Eagle opened its doors in September 1988. Ronald Reagan was in the final months of a popular presidency. His counterpart, Mikhail Gorbachev, was attempting to modernize the Soviet Union with initiatives like glasnost (openness) and perestroika (economic restructuring). Few foresaw anything more than gradual change. A year later, the Berlin Wall fell, and in three years the USSR itself collapsed.
The current state of the world is highly uncertain. The potential for geopolitical change driven by this White House administration is as wide as has existed since the end of the Cold War. The potential for technological change driven by AI advancements is as profound as the development of the internet and is moving much more quickly. While this is an exciting time to be an investor, it can also be unsettling. Tariff announcements made on April 2nd and the associated market crash will only exacerbate these feelings.
Be careful not to overreact.
There is always change, risk, and surprising market behavior. Since Eagle’s inception we have experienced the collapse of the Soviet Union, wars in the Middle East and Europe, oil at $8 and $147 per barrel, the commercialization of the internet, multiple technology bubbles and crashes, a global financial crisis, negative interest rates on German and Swiss bonds, 0.4% rates on 100-year Austrian bonds, sovereign defaults, a fifty-fold increase in Chinese GDP/capita, a hundred-fold increase in software market cap, a worldwide pandemic, and a decade marked by some of the highest S&P 500 returns on record immediately followed by a decade of losses.
Given this history, what is our current view of the world?
Based on last week’s tariff announcement, our central case when we model our companies is a moderate recession. There’s a wide distribution around this. Many aspects of the economy are healthy, and it’s reasonably possible that we avoid recession if there is rapid de-escalation. It’s also reasonably possible that we will have a deeper slowdown.
Embedded in our expectations are both the facts we have today and educated guesses about the next moves to unfold. We think the administration is serious about trying to change trade flows and will implement significant tariffs. We, however, expect the ultimate levies to come down from last week’s headline rates. We expect some retaliatory actions from other countries. We expect corporates to slow investment and hiring plans as uncertainty increases and profits decline. We expect Congress to pass tax cuts, which will mitigate some of the growth headwinds. And, with a lag, we expect monetary policy to loosen. We’re not certain on any of these, but it’s our best judgment at this point.
One contrary opinion we lean towards is that tariffs may not lead to the inflationary shock that many expect. Inflation is caused by too much money chasing too few goods. In the absence of a wider fiscal deficit, consumers will not have more money to spend. So, they will be forced to economize. They will accomplish this via a combination of buying fewer higher-priced tariffed goods as well as spending less on other discretionary purchases. This will put a disinflationary or even deflationary impulse on parts of the economy that become oversupplied relative to this new lower demand. For example, gasoline prices, hotel room rates, and airline tickets are likely to face incremental headwinds. A recession will cause an increase in unemployment, which tends to pressure wages. We expect high inflation in a small part of the economy and stable-to-declining prices across much of the rest. How these balance out is unclear.
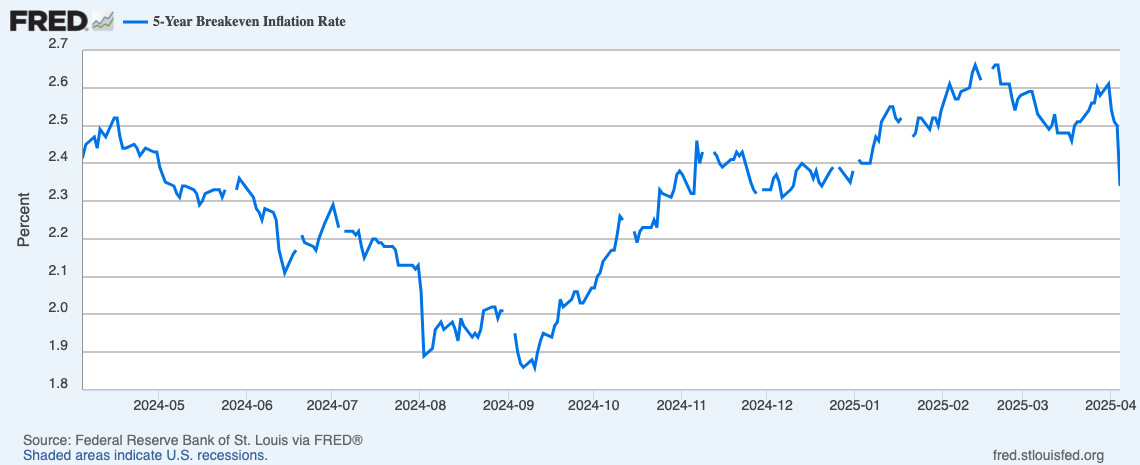
Bond market price action is consistent with this. Inflation breakevens, measured by the yield difference between nominal treasury bonds and TIPS, declined by 0.2% in the 48 hours following the tariff announcement.
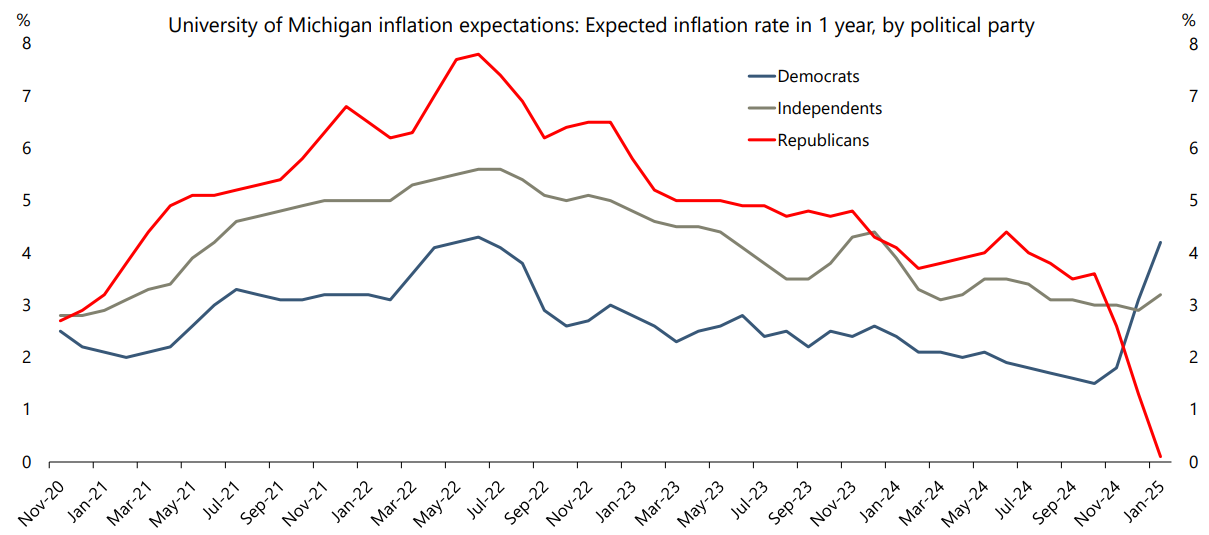
When reading views on inflation or other economic forecasts we must be wary of the author’s politics. The heightened polarization associated with Trump has tended to reduce the objectivity of opinions – on both sides.
Inflation expectations, by political party¹
It was a surprise to many that the dollar slightly weakened against other major currencies last week. This may simply be noise. But it also may be a warning that a period of extraordinary outperformance by U.S. assets is coming to an end. The U.S. runs a large current account deficit, predominantly due to its trade deficit. However, the mirror twin of this deficit is a large capital account surplus. These two items must balance.
Because foreigners sell more to us than they buy, they must hold the excess in dollar assets. This can come in the form of buying treasuries, stocks, direct investments, etc. Reducing the capital account surplus will lead to a lower rate of buying dollar assets. Capital flows move faster than operating flows, which is why monetary policy works on the economy with a lag but impacts financial assets immediately. It’s possible that some pools of overseas capital are starting to reposition down their U.S. exposure.
As we look past the initial economic shock, the future remains fuzzy. Tariffs are a form of consumption tax that is shared by consumers and foreign exporters. Many of those exporters are tightly integrated with U.S. multinationals. Accordingly, corporate profits ought to be somewhat lower and consumers should be somewhat less well-off. U.S. income tax cuts at both the personal and corporate levels are likely to mitigate some of this pressure.
The capitalist system is dynamic and adaptive. For example, the oil price dropped by $10 last week. This could translate to almost $75 billion per year of savings for U.S. oil consumers.² This alone is roughly 25% of the $300 billion that some expect to be raised from tariffs. As businesses and consumers adjust, the world will muddle through and self-correct.
It’s unclear how much manufacturing capacity will be added to the U.S. Quick-cycle projects with good returns on capital will happen. But fruits and vegetables that don’t thrive in the U.S. climate won’t suddenly grow here. Sneakers or apparel produced by low-cost labor aren’t likely to work much better. Even in more mechanized industries the results will be varied. Building a competitive aluminum smelter requires extremely cheap electricity, which rarely exists in the U.S. A smelter is a five-to-seven-year development project that then operates for thirty-to-fifty years. With tariffs changing week-to-week and almost certainly changing under future administrations, long-lived projects like this that require permanent subsidy are difficult to commission.
What does this mean for Eagle’s investing?
More of the same. We know that the world is highly uncertain. We have been surprised again and again over the past 36 years. Rather than attempt to build a portfolio for a specific future, we try to imagine a range of possible futures and construct a portfolio that can drive strong long-term returns – come what may. Recessions and economic disappointments are part of the market system. Over any given decade it’s reasonably likely that we’ll have one. We don’t try to time them because we think that’s generally a losing game. We invest with a five-to-ten-year view.
Eagle had a strong first quarter compared to the overall market.³ Don’t read too much into that. We will inevitably have lousy quarters and years too, and most of you have unfortunately seen a few of those. During market drawdowns, stocks are often driven more by supply-demand than by fundamentals. At times, we have compounded challenges by making mistakes. Still, by placing long-term bets on well-positioned companies, being value-oriented, and sufficiently diversifying the portfolio, we have historically been able to avoid permanent impairment and drive attractive returns over the cycle.
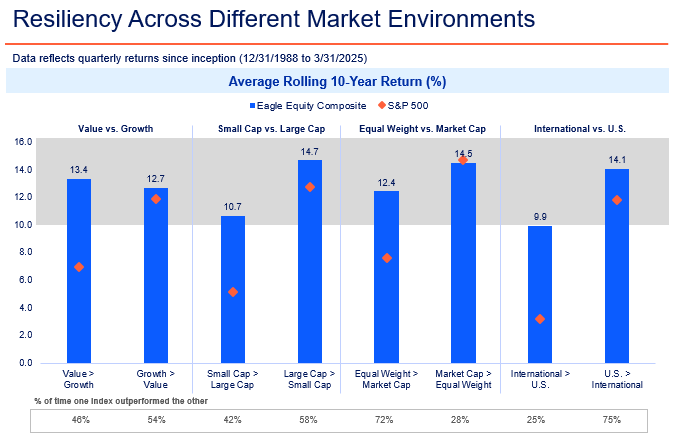
The chart below⁴ shows rolling 10-year returns for Eagle and the S&P 500 across different market environments. For example, the first two bars on the left show that Eagle’s results have been fairly consistent whether value or growth was outperforming. By contrast, value-led markets have historically been approximately 500bp worse for the S&P 500 than growth-led markets. In general, Eagle’s results have been more consistent across cycles.
The wide dispersion among stocks over the last several years has helped Eagle continue to recycle capital into fresh ideas. By and large, we are comfortable with and optimistic about the companies we hold.
We don’t currently believe any of our holdings will be severely impacted by changing tariff policies. There will be some scrapes or broken wrists, but nothing that is unmanageable. The principal impact on the portfolio will be from a broader economic slowdown. If the world goes into a recession, many of our companies will, naturally, have earnings headwinds.
For example, in last week’s crash, two of our worst performers were ConocoPhillips and Capital One. Neither has direct tariff exposure. However, oil dropped sharply, and investors in banks are understandably nervous about near-term consumer credit risk. We expect both companies to have earnings pressure in 2025-6. Ironically, Capital One received good news last week that the DOJ is not objecting to its acquisition of Discover. We expect it to receive approval from the Federal Reserve and OCC in the second quarter. So, while the short term is bleaker than it was a week ago, the long-term is arguably a bit brighter.
Because we are investing with a five-to-ten-year view, our valuation work is anchored on the earnings power of our portfolio companies out in 2030 and beyond. On this horizon, we expect relatively subdued impacts from last week’s news. Some positions have a low-to-mid-teen earnings headwind in our base case. But most have somewhere between a modest headwind to even a modest tailwind. Companies with stable earnings that are returning capital may see higher EPS out five years if this shock causes temporary stock price declines that they can take advantage of. AerCap, the world’s largest aircraft owner, is in the enviable position of having long-term leases and selling an undersupplied product. Over the past two years it has reduced its share count by 25% and the company may buy back more than 10% of its shares this year. A moderate recession is unlikely to significantly impact its revenue, and lower interest rates may modestly reduce its costs. As a result of these various moving pieces, our 2030 EPS estimates inch higher. Eagle owns several companies that we believe are similarly situated.
We expect a turbulent year ahead, while keeping in mind that the world has changed radically and unpredictably many times before. We’re optimistic about the opportunities we have in the portfolio today and the ones that are likely to be created. Thank you for your trust.
As always, if you have any questions or would like to discuss anything herein, please call us at (212) 293-4040. Also, if your financial situation or investment objectives have changed, if your IPO eligibility or U.S. Person status has changed, or if you would like to modify or discuss any investment restrictions or guidelines, please reach out to your contact on the client team or email ClientServices@eaglecap.com.⁵
1 “Inflation expectations, by political party,” Apollo Academy, accessed April 7, 2025, https://www.apolloacademy.com/wp-content/uploads/2025/01/012425-chart.pdf. Additional sources: University of Michigan, Bloomberg, Apollo Chief Economist.
2 The U.S. consumes just over 20 million barrels per day of petroleum products. Most of this comes from oil, but some comes from natural gas liquids and biofuels. We are assuming here that non-oil feedstock prices decline in-line with oil prices.
3 Past performance is not indicative of future results. For Q1 2025, the Eagle Equity Composite returned 0.71% net of fees and expenses. Over this period, the S&P 500 returned -4.27%. For additional information regarding Eagle’s index comparisons and since inception performance calculation methodology, including specifically as it relates to 1-, 5-, and 10-year periods, see the additional content located at the conclusion of this letter and at eaglecap.com.
4 Past performance is not indicative of future results. Sources: Advent APX, Morningstar, Eagle Capital Analysis. The grey shaded area reflects the range of returns that are greater than 10%. This chart represents the average rolling 10-year returns of the Eagle Equity Composite (net of fees and expenses) and the S&P 500 Index in various market environments, such as Value outperforming Growth, Small Cap outperforming Large Cap, etc. For additional information regarding Eagle’s index comparisons and since inception performance calculation methodology, including specifically as it relates to 1-, 5-, and 10-year periods, see the additional content located at the conclusion of this letter and at eaglecap.com. All returns are calculated as of calendar year quarter-ends. The returns of the Eagle Equity Composite (net of fees and expenses), the S&P 500 Index (representing “Large Cap”, “Market Cap”, and “U.S.”), the Russell 1000 Value Index (“Value”), the Russell 1000 Growth Index (“Growth”), the Russell 2000 Index (“Small Cap”), the S&P 500 Equal Weighted Index (“Equal Weight”), and the MSCI World ex USA (“International”), reflect rolling 10-year periods, and the returns are calculated on a quarterly basis since the inception of Eagle Equity Composite (12/31/1988) for the time period referenced on the slide. Net of fees and expenses returns may vary by client. “Average” is the average return of all rolling 10-year periods within the data set.
5 Eagle Equity Composite holdings during Q1 2025 were as follows: AA; AER; AMZN; AON; BAYRY; COF; CHTR; CMCSA; COP; DFS; EL; ELV; GE; GEV; GOOG/L; HLT; HUM; INTU; LBRDA/K; LEN; LNSTY; META; MLM; MSFT; OXY; PROSY; PTC; SAFRY; SAP; SHEL; TSM; UNH; V; VMC; WFC; WWD; and WDAY.
Past performance is not indicative of future results, and there is no assurance that Eagle Capital’s investment objectives will be achieved or that the strategies employed by Eagle Capital will be successful. Except where otherwise indicated, the information contained in this content is based on matters as they exist as of the date of preparation of such material and not as of the date of distribution or any future date. This document does not constitute an offering of advisory services or advice or a recommendation or offer to sell or a solicitation to deal in any security or financial product in any jurisdiction. It is provided for informational purposes only and on the understanding that the recipient has sufficient knowledge and experience to be able to understand and make their own evaluation of the content described herein, any risks associated therewith and any related legal, tax or other material considerations. Recipients should not rely on this material in making any future investment decision. To the extent that the reader has any questions regarding the applicability of any specific issue discussed above to their specific portfolio or situation, clients and prospective investors are encouraged to contact Eagle Capital as well as to review other materials produced by Eagle Capital (including those available at eaglecap.com). Discussions herein relating to risk or any efforts to mitigate risk do not imply that any actions taken by or investment strategies employed by Eagle Capital are in any way low risk or risk free.
This document expresses the views of Eagle Capital as of the date indicated and such views are subject to change without further notice. Eagle Capital has no duty or obligation to update the information contained herein. Certain information contained in this content constitutes “forward-looking statements,” which can be identified by the use of forward-looking terminology such as “may,” “will,” “should,” “expect,” “anticipate,” “project,” “estimate,” “intend,” “continue,” or “believe,” the negatives thereof, other variations thereof or other comparable terminology. Due to various potential risks, uncertainties or actual events, the results or the actual performance of Eagle Capital’s investments may differ materially from those reflected or contemplated in such forward-looking statements.
Any discussion of specific companies contained herein is for informational purposes only and does not represent all of the securities purchased, sold or recommended by Eagle Capital. The reader should not assume that any investments in the securities identified and discussed herein were or will be profitable.
Any index referenced herein is presented because Eagle Capital feels that it serves as a useful point of comparison with aspects of Eagle Capital’s portfolio management. The S&P 500 Index includes approximately 500 leading companies and captures more than three quarters of the total market capitalization. It is float-adjusted and based on the market cap weightings of the securities that comprise the index. In contrast, the Eagle Equity Strategy is highly concentrated and may contain companies not listed in the S&P 500 Index. The Russell 1000 Value Index measures the performance of the large-cap value segment of the US equity universe. It includes those Russell 1000 companies with lower price-to-book ratios and lower forecasted growth values. In contrast, the Eagle Equity Strategy is highly concentrated and may contain companies not listed in the Russell 1000 Value Index. The Russell 1000 Growth Index measures the performance of the large-cap growth segment of the US equity universe. It includes those Russell 1000 companies with relatively higher price-to-book ratios and higher forecasted growth values. In contrast, the Eagle Equity Strategy is highly concentrated and may contain companies not listed in the Russell 1000 Growth Index.

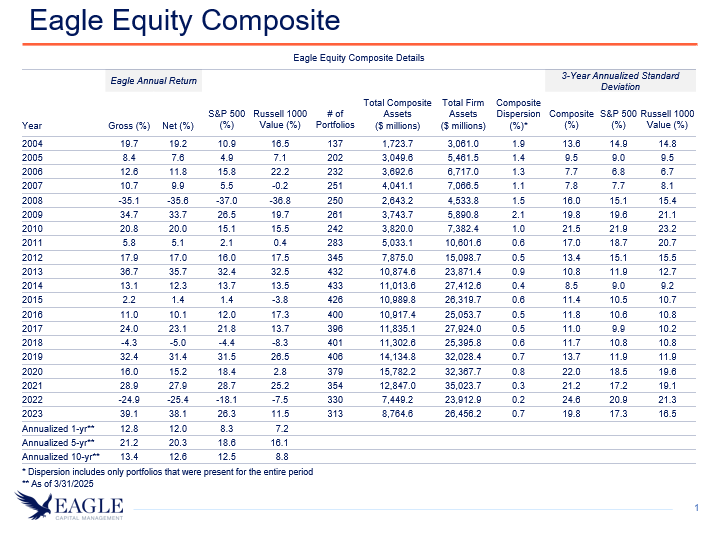
Past performance is not indicative of future results. Information shown is specific to the Eagle Equity Composite. For the GIPS Report in relation to the Eagle Equity Composite, see the content at the conclusion of this letter.
1. Eagle Capital Management, LLC (the “Adviser” or “Eagle”) is an investment adviser registered with the Securities and Exchange Commission. Eagle Capital Management was founded in August 1988 as a corporation. In March 1995, Eagle Capital Management, LLC was formed. Client accounts were transferred at the time of the change and their performance is included in this composite. The Eagle Equity Composite’s inception and creation date is 12/31/1988.
2. Originally, for periods prior to 1/1/1993, Eagle calculated performance utilizing an equal-weighted calculation methodology, and performance reporting included the carved-out equity segment of two balanced portfolios managed to the Eagle Equity Strategy. Each of these carved-out equity segment returns were calculated using an asset-weighted calculation methodology assuming cash holdings equal to 1% of the assets under management of each account. For periods commencing on 1/1/1993, performance was calculated utilizing an asset-weighted calculation methodology. Effective as of 3/8/2021, Eagle began presenting performance for all periods by utilizing an asset-weighted calculation methodology in all instances.
3. The Eagle Equity Composite is defined to include all fee-paying non-taxable discretionary institutional accounts. The term institutional accounts include pension plans, public funds, Taft-Hartley, endowments, foundations, trusts, limited partnerships, and corporate accounts while excluding accounts of natural persons (e.g., IRAs). The minimum initial asset size for a portfolio to be included in the Eagle Equity Composite is $1 million, and institutional accounts included in the Eagle Equity Composite do not apply concentration or similar limits at the portfolio level. If a withdrawal or performance causes a portfolio included in the Eagle Equity Composite to diminish to a level deemed difficult to implement the intended investment strategy, the portfolio may be removed. Members of the Eagle Equity Composite are invested in the Eagle Equity Strategy.
4. The Eagle Equity Strategy is a concentrated, long-only, primarily large-cap equity strategy. The Eagle Equity Strategy invests solely in U.S. traded securities, including ADRs, and generally limits its portfolio holdings to 5% weights at purchase initially and 10% weights at market value. The strategy also generally limits sector exposure to 35% of the portfolio and considers companies with market capitalizations over $3 billion.
5. The Eagle Equity Strategy is not managed to a benchmark. The most common benchmarks chosen by the Adviser’s clients based on its strategy are the S&P 500 Index and the Russell 1000 Value Index which are included above. The S&P 500 Index includes 500 leading companies and captures more than three-quarters of the total market capitalization. It is float-adjusted and based on the market cap weightings of the securities that comprise the index. The Russell 1000 Value Index measures the performance of the large-cap value segment of the U.S. equity universe. It includes those Russell 1000 companies with relatively lower price-to-book ratios and lower forecasted growth values. The Russell 1000 Growth Index, which is not shown, is also chosen by the Adviser’s clients based on the strategy and is available upon request. The Russell 1000 Growth Index measures the performance of the large-cap growth segment of the U.S. equity universe. It includes those Russell 1000 companies with relatively higher price-to-book ratios and higher forecasted growth values. In contrast, the Eagle Equity Strategy is highly concentrated and may contain companies not listed in these indices.
6. Every fee-paying discretionary account is included in one composite up to and including the last month it is fully invested. Composite information is not representative of any individual client account. New portfolios are excluded from composites until deemed fully invested. Portfolios no longer under management are included in historical composites for the periods they were under management; they are excluded for all periods after the last full month they were in place. Descriptions of composites, limited distribution pooled funds, and broad distribution pooled funds are available upon request. In addition, policies for valuing investments, calculating performance, and preparing GIPS Reports are available upon request.
7. Do not assume that all transactions will be profitable or that future performance is in any way guaranteed by past results. Performance calculations are on a time-weighted and asset-weighted total return basis and reflect reinvestment of dividends and other earnings. Trade-date accounting valuation is used, and income is accrued. Returns from client to client will vary slightly depending on portfolio size, diversification, and transaction costs. In the process of active portfolio management, short-term investments may be held in portfolios pending investment. Product descriptions in this brochure should not be construed to mean that cash is immediately invested.
8. The Adviser’s standard annual asset-based management fee schedule is 1% of the account’s total assets on the first $5 million and 0.75% thereafter. Gross performance results are net of commissions but do not reflect the deduction of Eagle’s investment advisory fee, which will affect a client’s total return. Net returns are net of trading expenses (commissions), bank fees, foreign withholdings taxes, and Eagle’s actual investment advisory fee. The performance presented does not represent the return of any one individual investor. The current presentation may differ from previous presentations of historical data due to differences in assumptions, material market conditions, and estimates used to calculate the performance. An individual client account’s net return may differ significantly due to differences in fees, brokerage charges, other commissions, and/or any other expenses paid and the account’s date of inception. Additional information related to the fees charged by the Adviser can be found in its Form ADV Part 2 or in the respective Investment Management Agreement.
9. The currency used to express performance is the U.S. dollar.
10. Internal gross composite dispersion is calculated using the gross asset-weighted standard deviation of annual gross returns of those portfolios that were included in the composite for the entire year.
11. The three-year annualized gross standard deviation measures the variability of the composite and benchmark monthly returns over the previous 36-month period.
12. Eagle Capital Management, LLC claims compliance with the Global Investment Performance Standards (GIPS®) and has prepared and presented this report in compliance with the GIPS standards. Eagle Capital Management, LLC has been independently verified for the periods 1/1/1993 through 12/31/2023. A firm that claims compliance with the GIPS standards must establish policies and procedures for complying with all the applicable requirements of the GIPS standards. Verification provides assurance on whether the firm’s policies and procedures related to composite and pooled fund maintenance, as well as the calculation, presentation, and distribution of performance, have been designed in compliance with the GIPS standards and have been implemented on a firm-wide basis. The Eagle Equity Composite has had a performance examination for the periods 1/1/1993 through 12/31/2023. The verification and performance examination reports are available upon request.
13. A more detailed description of the assumptions utilized in any of the simulations, models, and/or analyses contained in this report is available upon request. Eagle does not represent that the information contained herein is accurate or complete, and it should not be relied upon as such; Eagle does not undertake any obligation to update the information contained herein. Recipients should not rely on this material in making any investment decision. This document does not constitute advice or a recommendation or offer to sell or a solicitation of any offer to buy any security.
GIPS® is a registered trademark of CFA Institute. CFA Institute does not endorse or promote this organization, nor does it warrant the accuracy or quality of the content contained herein.
Q1 2025 Letter: Tariffs and the Long View | Eagle Capital Management
Despite today's uncertainty, Eagle remains committed to building a resilient, long-term portfolio – just as we have through decades of transformation – by focus