One of the striking developments over the past several years has been the changing structure of public equity markets. Individual stocks and subsectors have become more reactive to both positive and negative sentiments. The market has become less efficient, which has improved the opportunity to add value.
To step back briefly, in 2020, there seemed to be no price too low for travel stocks and pandemic losers, while companies like Zoom and Peloton traded to lofty levels. Zoom’s market cap at its peak was nearly as large as SAP’s today. At the time, we attributed this to the market not knowing how to price a hundred-year event. Now we see it as an early indicator of this changing market structure.
In 2021, we had the meme stock and SPAC craze. In 2022, with the war in Europe, we had an inflationary shock, and internet giants like Amazon, Meta, and Netflix declined precipitously, while the commodity complex exploded higher amid temporary shortages. More recently, we have an increasingly euphoric AI capex trade. The picks and shovels are doing great while perceived losers gap down on provocative headlines as the market tries to sort this out.
The reason we’re seeing this degree of reaction is the change in market structure. Passive has taken so much of the market that there are fewer active market participants setting prices. Active sets price, passive takes price, and that works well so long as the remaining participants are sufficiently wise and diverse.
Over the past decade, multi-managers, also known as pods, have significantly expanded their footprint. They operate with leverage and tight risk frameworks, and they tend to cut losers quickly. Many of these strategies have de facto earnings momentum at their core. Systematic quant strategies typically incorporate momentum as well. Growth managers have outperformed value managers, and flows have followed suit; growth investors tend to operate with a momentum bias. Finally, retail is playing a bigger role and tends to chase momentum.
The result is that there is less diversity, and momentum is playing a more dominant role than in the past. It’s increasingly valuable to mine controversial or underexplored areas for great assets and then harvest the results as earnings growth unfolds. Eagle has been monetizing this development over the past several years, and we think it will continue offering good opportunities for the foreseeable future.
Eagle’s competitive advantages may be widening. Having duration is critical. It takes time, often years, for an earnings thesis to play out. It’s equally important to do deep research on individual companies. A lot of short-term trading is built around thematic baskets, but company microeconomics come to matter over the long term. Get the earnings right, and you’ll get the stocks right. Finally, it takes a willingness to be different. This can be uncomfortable at times.
When making investments, we think in terms of probabilities. For example, certain high-quality software companies seem to be priced for a 10th-15th percentile outcome. That means that across 85-90% of what we consider plausible, things should work out well. We know we won’t be right about everything, and that’s fine. A portfolio of bets like this should do well.
We want to build a portfolio for a range of possible futures, not bet on a specific future. While this often isn’t as exciting as chasing the hot thing, these little wins tend to compound.
A useful mental model is how small advantages in tennis unfold. Even the world’s best tennis players win scarcely more than half of their points. And yet, they convert this into winning more than 80% of matches. This carries three implications. First, they must play the point in front of them as hard and as well as possible. It is critical to get those little edges. Second, despite playing hard, they will lose almost half the time and must move on to the next point with equanimity. Third, they must separate the noise of random ball bounces from the signal of what is driving the true edge.
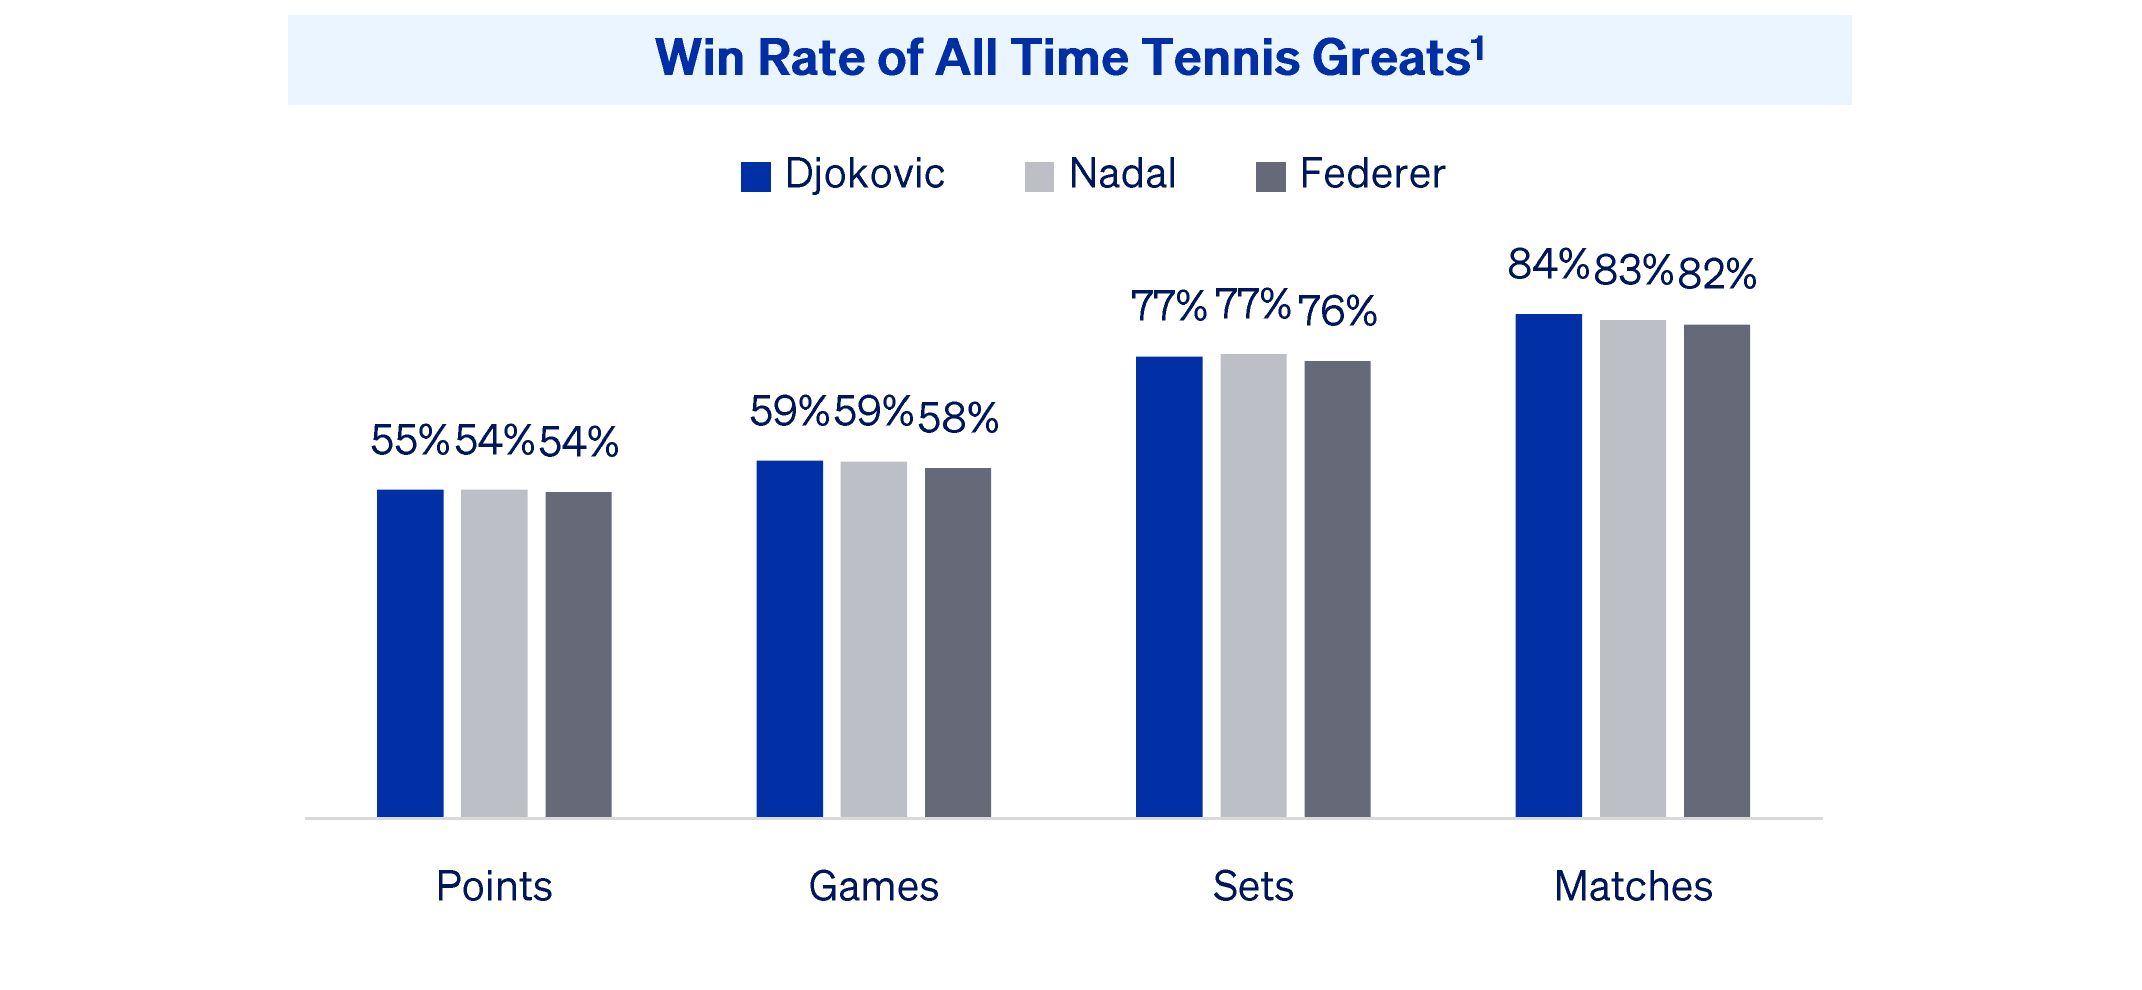
Eagle’s approach is similar, just on a different timescale. We aim to do the best work that we can each quarter, in both our research and decision-making. And yet, we underperform the market almost half of the time. As in tennis, these small, irregular advantages compound.

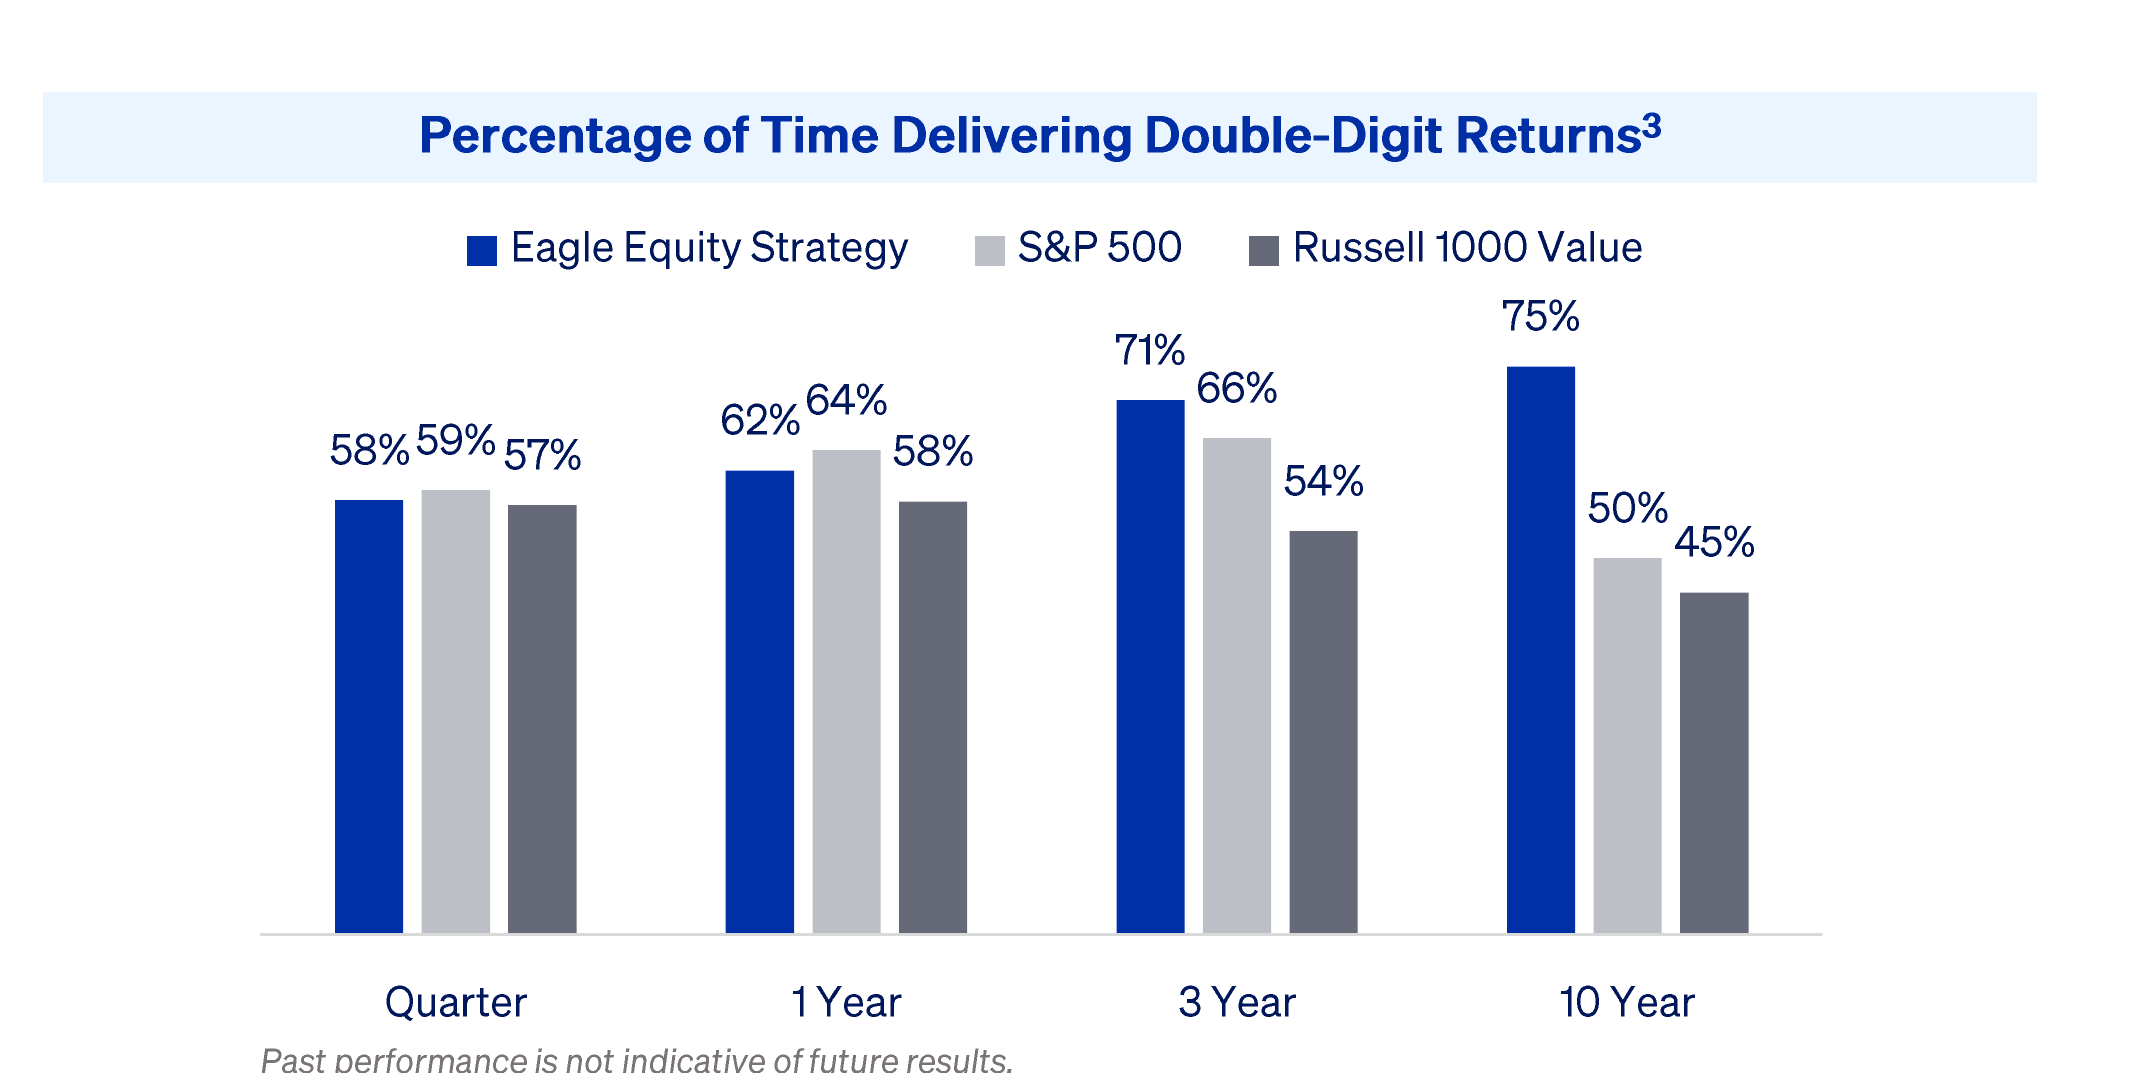
Our North Star is generating strong long-term absolute returns. Indeed, historically, Eagle shows a higher likelihood of clearing a double-digit hurdle as the time horizon extends. Meanwhile, as horizons extend, the odds decline that the S&P 500 and the Russell Value will clear this bar, for a simple reason: Most of the time, earnings, the economy, and markets are growing. But, from time to time, excesses build and then unwind. If investors can participate in the good times while avoiding getting caught up in the excesses, they achieve superior results.
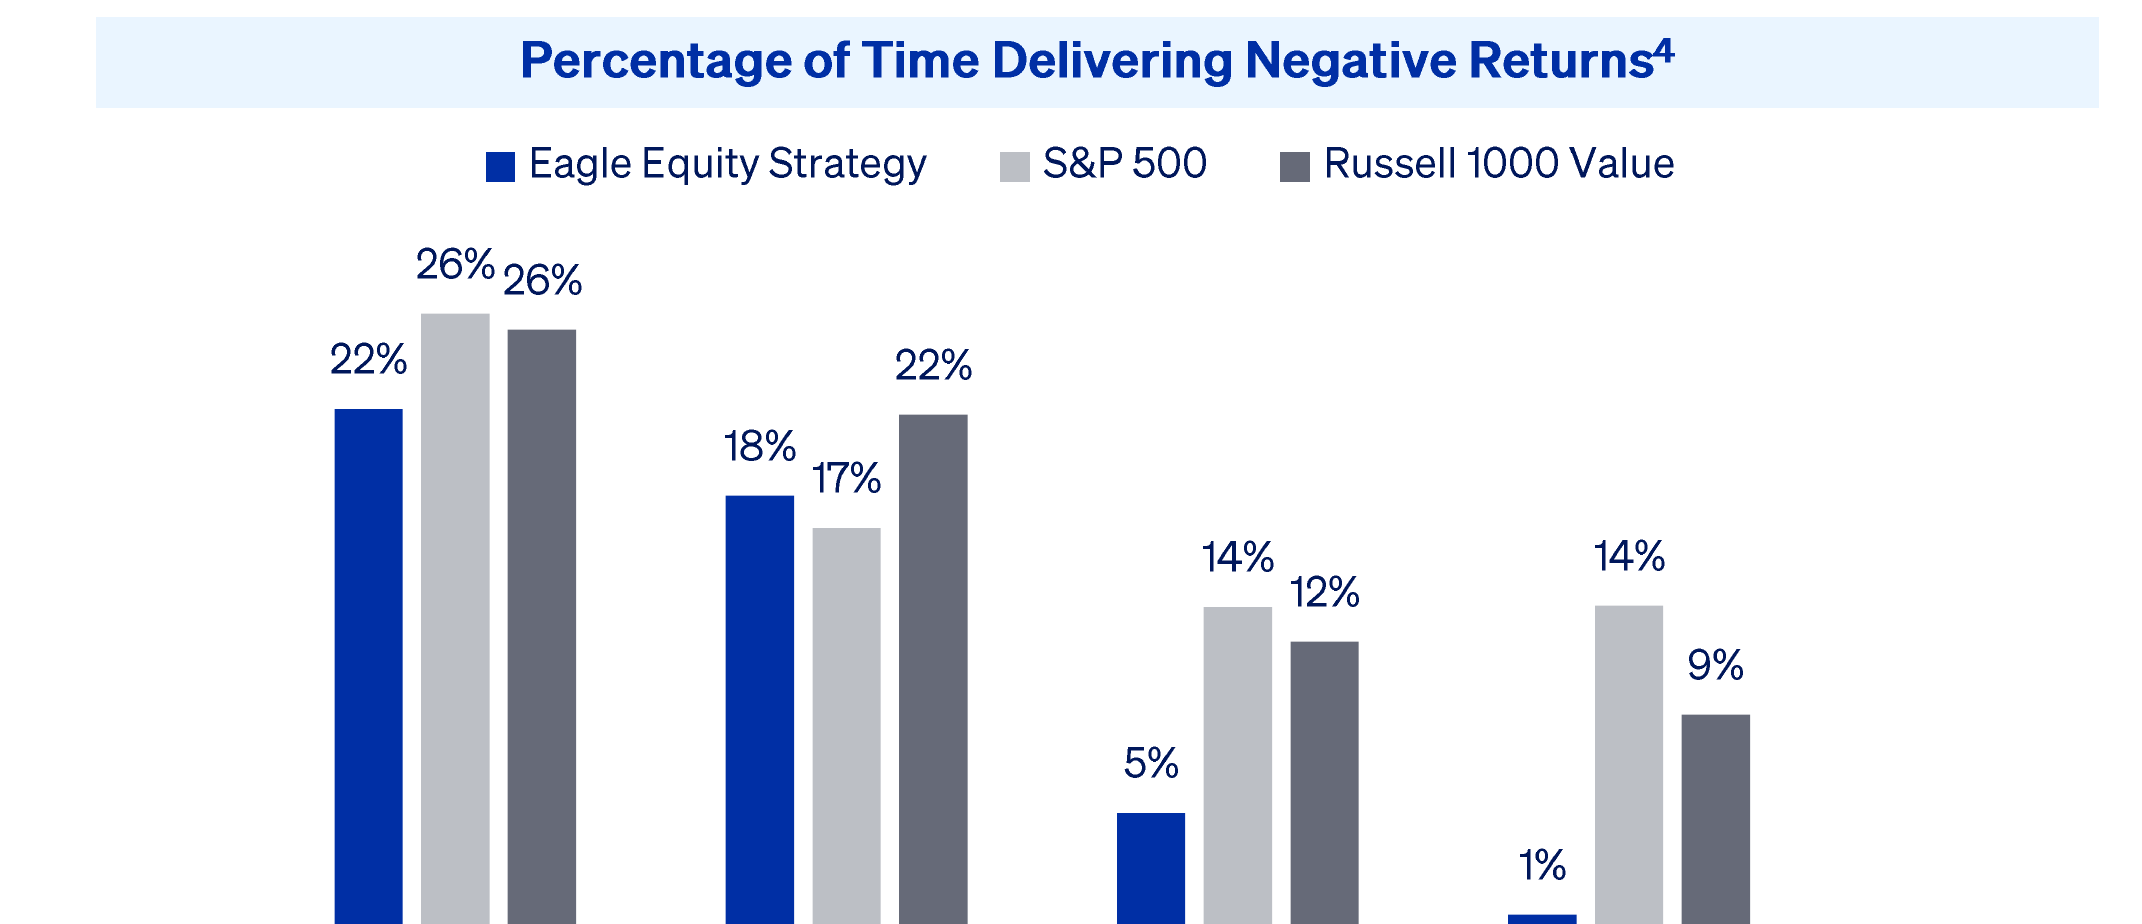
One way to visualize these unwinds is to examine periods of market declines. When measured over a quarter or a year, both Eagle and the overall market regularly post negative results. In the short term, stock prices are determined by supply and demand. However, as the time horizon extends, there is a gravitational pull exerted by business quality, earnings growth, and valuation discipline. Historically, as demonstrated in the following chart, there has been a roughly 1-in-7 chance that the S&P 500 will post negative returns over the next 3 or 5 years. For Eagle, it’s been 1-in-20 and 1-in-100, respectively.
On the following pages are several representative positions that Eagle has established or added to over the past several quarters. 5 Across the group, we see companies making decisions to build enduring businesses; we also see current market debates that may shift in our favor over time. Collectively, these companies trade at a wide discount to the overall market, despite our belief that they will have much faster-than-market earnings growth.
UnitedHealth Group and Humana, two of the leading providers of managed care, have significant scale advantages in a consolidated industry that outgrows the overall economy. The two companies have struggled over the past few years as Medicare Advantage went through a downcycle of cost/price squeeze. We believe conditions have bottomed and that we are transitioning to a multi-year improvement in margins and returns. Actions by each to reduce costs and implement AI through their businesses are incremental tailwinds. At our weighted position, we expect annual EPS growth exceeding 20%.
Mercado Libre is the leading e-commerce platform in Latin America, with a complementary fintech business. The company has a dominant share in most of its markets. It has used this position to build an integrated flywheel with payment and banking products that allow it to further monetize its platform and better engage with consumers and sellers. Latin America has relatively low e-commerce penetration —we estimate it at the mid-teens, compared with nearly 30% in the U.S. — enabling a longer runway for extraordinary growth.
The company is investing heavily to capture this opportunity. Last year, revenue growth accelerated to 39%, while margins declined. We expect further declines this year. We believe current earnings would be more than 50% higher without these investments. But foregoing this spending would be a mistake. In some ways, the company reminds us of Amazon a decade ago. As with Amazon, management operates the business well, doesn’t manage for short-term earnings, and has a superb track record of creating long-term value. We expect EPS growth to exceed 30% over the coming years.
SAP, Workday, and Intuit are highly entrenched application software businesses. SAP’s ERP software is among the stickiest and most durable businesses in the world. Workday is the only de novo ERP to be successfully built in decades, with the leading global human capital management position and a large financials platform. Intuit is a household name because of TurboTax, but its largest business and growth engine is QuickBooks, which operates as a functional monopoly in small-business accounting software in the U.S.
Software is lately controversial due to AI-driven disruption. AI is deflationary for engineering costs and will change many workflows in how software is used. The technology is widening the distribution of 5-to 10-year outcomes for these businesses. In some cases, the central tendency shifts lower; in others, it’s stable or even shifts upward. The entire space has sold off over the past year, and we believe the recovery will be more heterogeneous than the decline. Many businesses will be impaired, but a number will likely benefit.
We have positioned ourselves with companies that we expect to be comparatively resilient, that also have idiosyncratic earnings growth paths or call options. SAP will face tougher competition in its peripheral products, but its core is highly defensible, and we think it will grow rapidly over the next five years, driven by its cloud migration. Workday earns well bel ow normalized margins today and may reignite product development with the return of its founder to the CEO role. Intuit’s QuickBooks has singularly valuable distribution to small businesses and is weaving AI capabilities into its products to bette r serve this hard-to-reach customer. We expect EPS growth of around 20% for the group.
We’ve built a position in Danaher, a leading life sciences company. Danaher sells a broad mix of consumables and tooling that are mission-critical to biological R&D, diagnostic testing, and biopharma drug production. It has high market share, differentiated technology, strong management, and good growth prospects.
Over the last several years, Covid-related revenue disappeared, the biotech end-market boomed and then crashed, China slowed, and NIH funding was cut. As a result, this historically stable grower has been anything but stable or growing. It’s n ow trading at a depressed multiple on depressed earnings. With lower-quality earnings flushed out of the base and other parts running below trend, we expect improving, and possibly even above trend, growth over the coming years. Moreover, one of the most exciting areas of exploration for AI technology is in biopharma research. This has the potential to be a medium-to long-term accelerant for Danaher’s business. We expect EPS growth in the mid-teens.
London Stock Exchange Group (“LSEG”) and S&P Global operate critical financial market infrastructure. LSEG has trading and clearing venues, data and applications businesses, and the FTSE Russell Index business. S&P Global operates the S&P ratings business, the S&P index business, Platts, and a portfolio of data and applications businesses. The segments generally have dominant market share or even monopoly positions, above-GDP revenue growth, high margins with even higher incrementals , and good free-cash-flow conversion.
These stocks are interesting today because each also has AI-disruption risk in parts of the enterprise. Our analysis indicates that these risks are limited to a small subset of the business and are likely more than offset by AI-driven upside in the data segments. In time, we believe the stocks are reasonably likely to be perceived as beneficiaries of AI. Given today’s depressed multiples, this situation presents an attractive asymmetry. We forecast EPS growth in the mid-teens in the coming years.
EQT is the largest pure play U.S. natural gas producer. The company has long-lived assets, with decades of inventory. It also has a low-cost structure due to its enviable position in the Marcellus shale and captive pipeline assets. Management has an excellent track record of making wise strategic and capital allocation decisions. Despite selling a commodity product, EQT is a high-quality business with operating margins exceeding those of 80-90% of S&P 500 companies. Natural gas in the U.S. trades at a wide discount to global prices. The combination of the inflection in U.S. electricity demand, LNG export growth, and disruption in the Middle East may narrow this discount over the next 5-10 years. We expect EPS growth in the mid-teens.
The pace of change is accelerating, and the market structure we described at the start of this letter amplifies its effect on prices. When more participants are chasing momentum, sharper moves create sharper opportunities. That’s an uncomfortable environment to weather, but a productive one to invest in. We plan to keep doing the work, company by company and point by point, letting the compounding take care of itself. Thank you for the partnership and trust that make this approach possible.
As always, if you have any questions or would like to discuss anything herein, please call us at (212) 293-4040. Also, if your financial situation or investment objectives have changed, if your IPO eligibility or U.S. Person status has changed, or if you would like to modify or discuss any investment restrictions or guidelines, please reach out to your contact on the client team or email ClientServices@eaglecap.com.
1 Source: Eagle Capital analysis.
2 Sources: Advent APX; Eagle Capital analysis. This chart represents the excess returns of the Eagle Equity Composite (net of fees and expenses) relative to the S&P 500 Index and the Russell 1000 Value Index for rolling quarterly, 1-year, 3-year, and 10-year periods. The returns are calculated on a quarterly basis since the inception of Eagle Equity Composite (12/31/1988) for the time periods noted above. For additional information regarding Eagle’s index comparisons and since inception performance calculation methodology, including specifically as it relates to 1-, 5-, and 10-year periods, please see the final pages of this letter.
3 Sources: Advent APX; Eagle Capital analysis. The returns of the Eagle Equity Composite (net of fees and expenses), the S&P 500, and Russell 1000 Value indices are annualized and compared for rolling quarterly, 1-year, 3-year, and 10-year time periods. The returns are calculated on a quarterly basis since the inception of Eagle Equity Composite (12/31/1988) for the time periods noted above. For additional information regarding Eagle’s index comparisons and since inception performance calculation methodology, including specifically as it relates to 1-, 5-, and 10-year periods, please see the final pages of this letter.
4 Sources: Advent APX; Eagle Capital analysis. The returns of the Eagle Equity Composite (net of fees and expenses), the S&P 500, and Russell 1000 Value indices are compared for rolling quarterly, 1-year, 3-year, and 5-year time periods. The returns are calculated on a quarterly basis since the inception of Eagle Equity Composite (12/31/1988) for the time periods noted above. For additional information regarding Eagle’s index comparisons and since inception performance calculation methodology, including specifically as it relates to 1-, 5-, and 10-year periods, please see the final pages of this letter.
5 Eagle Equity Composite holdings during Q1 2026 were as follows: AA; AER; AJG; AMZN; AON; ASML; BAYRY; CHTR; CMCSA; COF; COP; DHR; EL; ELV; EQT; GEV; GOOG/L; HLT; HUM; INTU; LBRDA/K; LEN; LNSTY; LSEGY; MA; MELI; META; MLM; MSFT; NFLX; PTC; SAP; SHEL; SPGI; TSM; UNH; VMC; VSNT; WDAY; WFC; and WWD.
Past performance is not indicative of future results, and there is no assurance that Eagle Capital’s investment objectives will be achieved or that the strategies employed by Eagle Capital will be successful. Except where otherwise indicated, the information contained in this content is based on matters as they exist as of the date of preparation of such material and not as of the date of distribution or any future date. This document does not constitute an offering of advisory services or advice or a recommendation or offer to sell or a solicitation to deal in any security or financial product in any jurisdiction. It is provided for informational purposes only and on the understanding that the recipient has sufficient knowledge and experience to be able to understand and make their own evaluation of the content described herein, any risks associated therewith and any related legal, tax or other material considerations. Recipients should not rely on this material in making any future investment decision. To the extent that the reader has any questions regarding the applicability of any specific issue discussed above to their specific portfolio or situation, clients and prospective investors are encouraged to contact Eagle Capital as well as to review other materials produced by Eagle Capital (including those available at eaglecap.com). Discussions herein relating to risk or any efforts to mitigate risk do not imply that any actions taken by or investment strategies employed by Eagle Capital are in any way low risk or risk free.
This document expresses the views of Eagle Capital as of the date indicated and such views are subject to change without further notice. Eagle Capital has no duty or obligation to update the information contained herein. Certain information contained in this content constitutes “forward-looking statements,” which can be identified by the use of forward-looking terminology such as “may,” “will,” “should,” “expect,” “anticipate,” “project,” “estimate,” “intend,” “continue,” or “believe,” the negatives thereof, other variations thereof or other comparable terminology. Due to various potential risks, uncertainties or actual events, the results or the actual performance of Eagle Capital’s investments may differ materially from those reflected or contemplated in such forward-looking statements.
Any discussion of specific companies contained herein is for informational purposes only and does not represent all of the securities purchased, sold or recommended by Eagle Capital. Additionally, certain companies that are referenced herein may not be held in the Eagle portfolio; a list of all Eagle Equity Composite holdings for the applicable period appears above. The reader should not assume that any investments in the securities identified and discussed herein were or will be profitable.
Any index referenced herein is presented because Eagle Capital feels that it serves as a useful point of comparison with aspects of Eagle Capital’s portfolio management. The S&P 500 Index includes approximately 500 leading companies and captures more than three quarters of the total market capitalization. It is float-adjusted and based on the market cap weightings of the securities that comprise the index. In contrast, the Eagle Equity Strategy is highly concentrated and may contain companies not listed in the S&P 500 Index. The Russell 1000 Value Index measures the performance of the large-cap value segment of the US equity universe. It includes those Russell 1000 companies with lower price-to-book ratios and lower forecasted growth values. In contrast, the Eagle Equity Strategy is highly concentrated and may contain companies not listed in the Russell 1000 Value Index.
Data as of 3/31/2026, unless otherwise noted. Annualized performance.
| Q1 2026 | One Year | Three Year | Five Year | Ten Year | Since Inception (12/31/1988) | |
|---|---|---|---|---|---|---|
| Portfolio (Gross) | -6.3% | 10.0% | 20.4% | 11.2% | 14.7% | 14.7% |
| Portfolio (Net) | -6.4% | 9.2% | 19.5% | 10.4% | 13.9% | 13.9% |
| S&P Index | -4.3% | 17.8% | 18.3% | 12.1% | 14.2% | 11.1% |
| Russell 1000 Value Index | 2.1% | 15.9% | 14.3% | 9.4% | 10.6% | 10.2% |
Past performance is not indicative of future results. Information shown is specific to the Eagle Equity Composite. For the GIPS Report in relation to the Eagle Equity Composite, see the content immediately below.
Eagle Annual Return and 3-Year Annualized Standard Deviation.
| Year | Gross (%) | Net (%) | S&P 500 (%) | Russell 1000 Value (%) | # of Portfolios | Total Composite Assets ($ millions) | Total Firm Assets ($ millions) | Composite Dispersion (%)* | Composite 3-Yr Std Dev (%) | S&P 500 3-Yr Std Dev (%) | Russell 1000 Value 3-Yr Std Dev (%) |
|---|---|---|---|---|---|---|---|---|---|---|---|
| 2016 | 11.0 | 10.1 | 12.0 | 17.3 | 400 | 10,917.4 | 25,053.7 | 0.5 | 11.8 | 10.6 | 10.8 |
| 2017 | 24.0 | 23.1 | 21.8 | 13.7 | 396 | 11,835.1 | 27,924.0 | 0.5 | 11.0 | 9.9 | 10.2 |
| 2018 | -4.3 | -5.0 | -4.4 | -8.3 | 401 | 11,302.6 | 25,395.7 | 0.6 | 11.7 | 10.8 | 10.8 |
| 2019 | 32.4 | 31.4 | 31.5 | 26.5 | 406 | 14,134.8 | 32,028.4 | 0.7 | 13.7 | 11.9 | 11.9 |
| 2020 | 16.0 | 15.2 | 18.4 | 2.8 | 379 | 15,782.2 | 32,367.7 | 0.8 | 22.0 | 18.5 | 19.6 |
| 2021 | 28.9 | 27.9 | 28.7 | 25.2 | 354 | 12,847.0 | 35,023.7 | 0.3 | 21.2 | 17.2 | 19.1 |
| 2022 | -24.9 | -25.4 | -18.1 | -7.5 | 330 | 7,449.2 | 23,912.9 | 0.2 | 24.6 | 20.9 | 21.3 |
| 2023 | 39.1 | 38.1 | 26.3 | 11.5 | 313 | 8,764.6 | 26,456.2 | 0.7 | 19.8 | 17.3 | 16.5 |
| 2024 | 26.5 | 25.5 | 25.0 | 14.4 | 291 | 9,592.6 | 31,169.5 | 0.6 | 18.7 | 17.2 | 16.7 |
| 2025 | 18.4 | 17.5 | 17.9 | 15.9 | 282 | 11,127.3 | 35,796.2 | 0.9 | 11.9 | 11.8 | 12.4 |
| Annualized 1-yr** | 10.0 | 9.2 | 17.8 | 15.9 | — | — | — | — | — | — | — |
| Annualized 5-yr** | 11.2 | 10.4 | 12.1 | 9.4 | — | — | — | — | — | — | — |
| Annualized 10-yr** | 14.7 | 13.9 | 14.2 | 10.6 | — | — | — | — | — | — | — |
* Dispersion includes only portfolios that were present for the entire period.
** As of 3/31/2026.
1. Eagle Capital Management, LLC (the “Adviser” or “Eagle”) is an investment adviser registered with the Securities and Exchange Commission. The Eagle Equity Composite’s inception and creation date is 12/31/1988.
2. Originally, for periods prior to 1/1/1993, Eagle calculated performance utilizing an equal-weighted calculation methodology, and performance reporting included the carved-out equity segment of two balanced portfolios managed to the Eagle Equity Strategy. Each of these carved-out equity segment returns were calculated using an asset-weighted calculation methodology assuming cash holdings equal to 1% of the assets under management of each account. For periods commencing on 1/1/1993, performance was calculated utilizing an asset-weighted calculation methodology. Effective as of 3/8/2021, Eagle began presenting performance for all periods by utilizing an asset-weighted calculation methodology in all instances.
3. The Eagle Equity Composite includes all fee-paying, non-taxable discretionary institutional accounts, such as pension plans, public funds, Taft-Hartley, endowments, foundations, trusts, limited partnerships, and corporate accounts, while excluding accounts of natural persons (i.e., IRAs). The minimum initial asset size for inclusion is $1 million. Concentration or similar limits do not apply at the portfolio level. If a withdrawal or performance causes a portfolio to diminish to a level deemed difficult to implement the intended investment strategy, the portfolio may be removed. Members of the Eagle Equity Composite are invested in the Eagle Equity Strategy.
4. The Eagle Equity Strategy is a concentrated, long-only, primarily large-cap equity strategy which invests solely in U.S.-traded securities, including ADRs, and generally limits its portfolio holdings to 5% at purchase initially and 10% at market value. Sector exposure is generally limited to 35% of the portfolio, focusing on companies with market capitalizations over $3 billion.
5. The Eagle Equity Strategy is not managed to a benchmark. The most common benchmarks chosen by the Adviser’s clients based on its strategy are the S&P 500 Index and the Russell 1000 Value Index which are included above.
6. Do not assume that all transactions will be profitable or that future performance is in any way guaranteed by past results. Performance calculations are on a time-weighted and asset-weighted total return basis and reflect reinvestment of dividends and other earnings. Returns from client to client will vary slightly depending on portfolio size, diversification, and transaction costs. In the process of active portfolio management, short-term investments may be held in portfolios pending investment. Product descriptions in this brochure should not be construed to mean that cash is immediately invested.
7. The Adviser’s standard annual management fee generally ranges from 0.75% to 1.00% of assets under management, depending on asset levels and applicable fee arrangements. Gross performance is net of commissions but does not reflect Eagle’s investment advisory fee, which affects a client’s total return. Net performance is net of commissions, bank fees, foreign withholdings taxes, and Eagle’s actual fee. The performance presented does not represent any individual investor’s return. The current presentation may differ from previous presentations due to changes in assumptions, market conditions, and estimates used in calculations. Individual client net returns may differ significantly based on fees, brokerage charges, commissions, other expenses, and account inception date. Additional information related to the Advisor’s fees can be found in its Form ADV Part 2 or the respective Investment Management Agreement.
8. Internal gross composite dispersion is calculated using the gross asset-weighted standard deviation of annual gross returns of those portfolios that were included in the composite for the entire year. The three-year annualized gross standard deviation measures the variability of the composite and benchmark monthly returns over the previous 36-month period. The currency used to express performance is the U.S. dollar.
9. Eagle Capital Management, LLC claims compliance with the Global Investment Performance Standards (GIPS®) and has prepared and presented this report in compliance with the GIPS standards. Eagle Capital Management, LLC has been independently verified for the periods 1/1/1993 through 12/31/2025. A firm that claims compliance with the GIPS standards must establish policies and procedures for complying with all the applicable requirements of the GIPS standards. Verification provides assurance on whether the firm’s policies and procedures related to composite and pooled fund maintenance, as well as the calculation, presentation, and distribution of performance, have been designed in compliance with the GIPS standards and have been implemented on a firm-wide basis. The Eagle Equity Composite has had a performance examination for the periods 1/1/1993 through 12/31/2025. The verification and performance examination reports are available upon request.
10. The following materials are available upon request: (i) descriptions of composites, limited distribution pooled funds, and broad distribution pooled funds; (ii) policies for valuing investments, calculating performance, and preparing GIPS Reports; and (iii) a more detailed description of the assumptions utilized in any of the simulations, models, and/or analyses contained in this report. Eagle does not represent that the information contained herein is accurate or complete, and it should not be relied upon as such; Eagle does not undertake any obligation to update the information contained herein. Recipients should not rely on this material in making any investment decision. This document does not constitute advice or a recommendation or offer to sell or a solicitation of any offer to buy any security.
GIPS® is a registered trademark of CFA Institute. CFA Institute does not endorse or promote this organization, nor does it warrant the accuracy or quality of the content contained herein.
Q1 2026 Letter: Less Diverse, More Momentum | Eagle Capital Management
Active sets price; passive takes it. As the share of price-setting capital has shrunk and momentum strategies have grown, individual stocks and subsectors swing