We come to praise the S&P 500, not to bury it. Across much of Wall Street, the index is a source of frustration and envy. This has the flavor of sour grapes. Clients often approach us with a desire to understand the situation better. In that spirit of inquiry, we’d like to share our thoughts.
Passive index funds have deservedly gained market share because they demonstrate superior returns, less risk, and lower cost. Why is this the case? Will it always be so? How does the present set of circumstances compare with history?
The index fund is a wonderful piece of financial technology, perhaps the best of any invented in the past 50 years. It is a simple, low-cost way to own a broad slice of the economy. It is adaptive and well-designed to automatically shrink positions in companies undergoing creative destruction and to capture the right-tail outcomes that episodically happen in capitalism. Over the long term, it has outperformed most active managers.
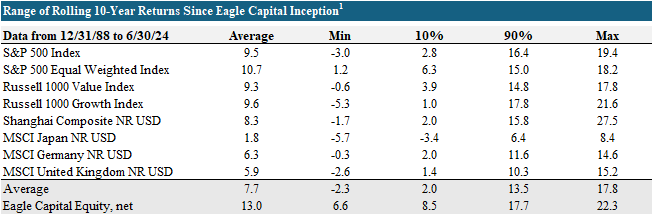
Will the future look like the past? It depends. As with most investment decisions, the buyer’s time horizon matters. We believe the S&P 500 is a reasonably good bet over 30 years. Over 10 years, it looks riskier. High starting valuations and greater-than-typical concentration risk mean that investors in the index may need longer than usual to earn acceptable returns. Below, we show the 10-year rolling returns of several major U.S. and international equity indices through Eagle’s history over the past four decades. It shows average returns, the min/max, and the 10th and 90th percentile.¹ A few observations:
• Lost decades for entire markets are not as rare as one might think. 10% of the time, investors earned only 2%/year, achieving zero real return after the impact of inflation.
• The U.S. has been a good place to be. All four U.S. indices beat the four international markets.
• Within the U.S., the equal-weighted index showed better average performance than the market cap-weighted index and better downside protection. Value slightly underperforms growth on average but demonstrates much better downside protection.
• Eagle has produced the strongest average returns and the strongest downside protection.
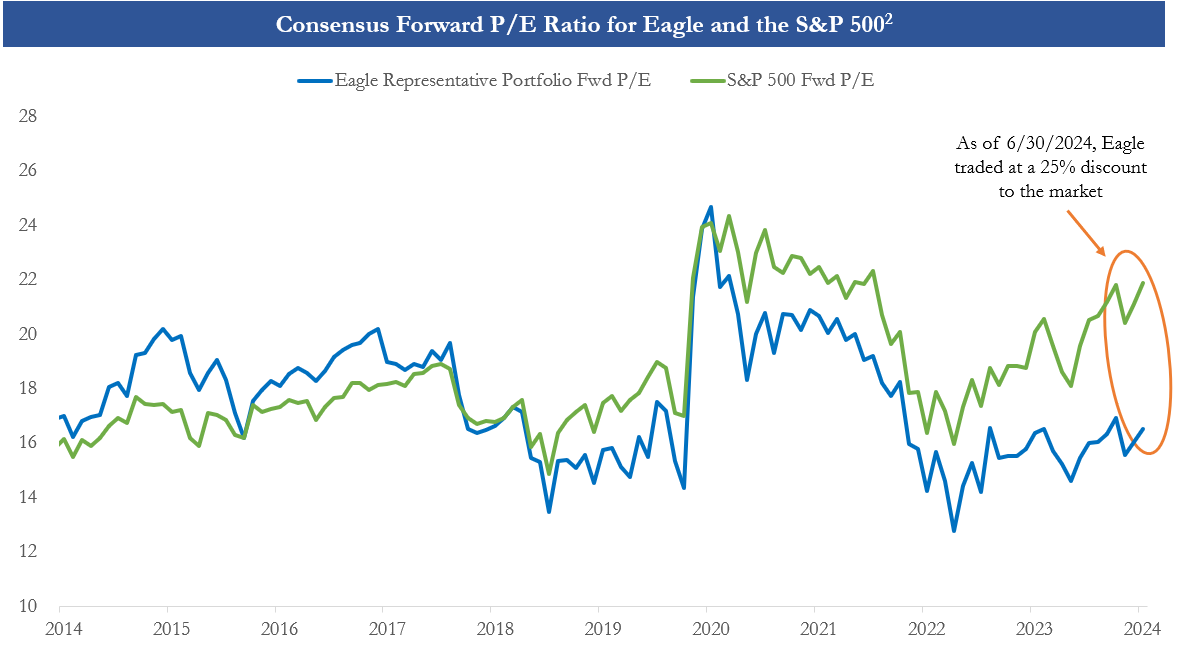
Over the past decade, the S&P 500 compounded at 12.9%, well above its long-term average. While earnings growth was typical, we saw dramatic multiple expansion from ~16x to ~22x. It’s worth considering the forward-looking risk/return for a passive portfolio that cannot make adjustments and is trading at such an elevated multiple. Our best judgment is that the next decade will be below average for the S&P 500, largely because of mean reversion pressures on valuation. Mid-single-digit returns would not surprise us.
Given these findings, it’s tempting to suggest investors in the S&P 500 market cap-weighted index reallocate capital to the equal-weighted one. The latter has underperformed over the past decade, and it doesn’t appear to have as much overvaluation as the broader index. This may be a good tactical trade, but we don’t like this asset. Mechanically equal-weighting these 500 companies drives nonsensical decision rules that are likely to erode long-term investment performance. For example:
• When a company acquires its peer, the equal-weighted index cuts the position in half. Imagine how strange it is when an industry consolidates—likely driving better pricing power and margins—to want to own much less.
• Sectors with high fragmentation are overrepresented compared to those with a few dominant players.
• When a company does a spin-off, the equal-weighted index arbitrarily doubles the position in each pro forma company.
• When an industry is undergoing secular disruption, as newspapers or retailers did, the index keeps adding to those positions the whole way down until they get so small they’re kicked out.
• When a company or industry is spectacularly growing and getting more profitable, the index mechanically sells and sells.
Common sense argues against believing that equal-weighted indices will durably outperform market cap-weighted ones, despite what the last 35 years of data say. Longer data series support this intuition. Hendrik Bessembinder studied stock market returns from 1926 to 2016. He found that only 4% of stocks drove the entire outperformance of the U.S. stock market versus treasuries. Capturing right-tail outcomes is a critical part of long-term equity market investing. An equal-weighted index is poorly constructed to accomplish this.
If the market cap-weighted index is expensive and the equal-weighted is poorly constructed, is there any useful takeaway to act on? We think so. The recent underperformance of the equal-weighted index reveals that the market of stocks is particularly heterogeneous at the moment. Eagle is capitalizing on this with our portfolio valuation showing the opposite trend to the S&P 500.
A decade ago, Eagle’s portfolio traded for a modest premium to the overall market. This reflected bottom-up analysis that led us to companies we felt had strong enough prospects to deserve this confidence. These decisions have generally paid off. Today, Eagle’s portfolio trades at a wide discount to the overall market. So, while the S&P 500’s multiple is up 36% from a decade ago, our portfolio is slightly below its prior multiple. We have been actively recycling capital from yesterday’s opportunities into tomorrow’s.²
One of the areas that Eagle has been trimming is our technology holdings. An unfair criticism of the S&P 500 is that these stocks have been disproportionate beneficiaries of loose Fed policy. While it’s likely that easy money benefited all financial asset prices, the data are clear that earnings have been the main driver behind this group’s success. We don’t think it’s a bubble. We are simply finding what we consider to be better opportunities for incremental capital elsewhere.
The table on the following page shows revenue, gross profit, operating profit (“EBIT”), and earnings per share (“EPS”) for the six largest companies in the S&P 500, all of which are technology-related.³ A few points to highlight:
• Over the past decade, median EPS and median stock price total return have compounded in sync at 28% and 27% respectively.
• The three largest companies in the S&P 500—Microsoft, Apple, and Nvidia—have benefited from multiple expansion. Shareholder return materially outpaced earnings growth.
• By contrast, Alphabet, Amazon, and Meta grew earnings faster than shareholder return, meaning multiples contracted for these companies.
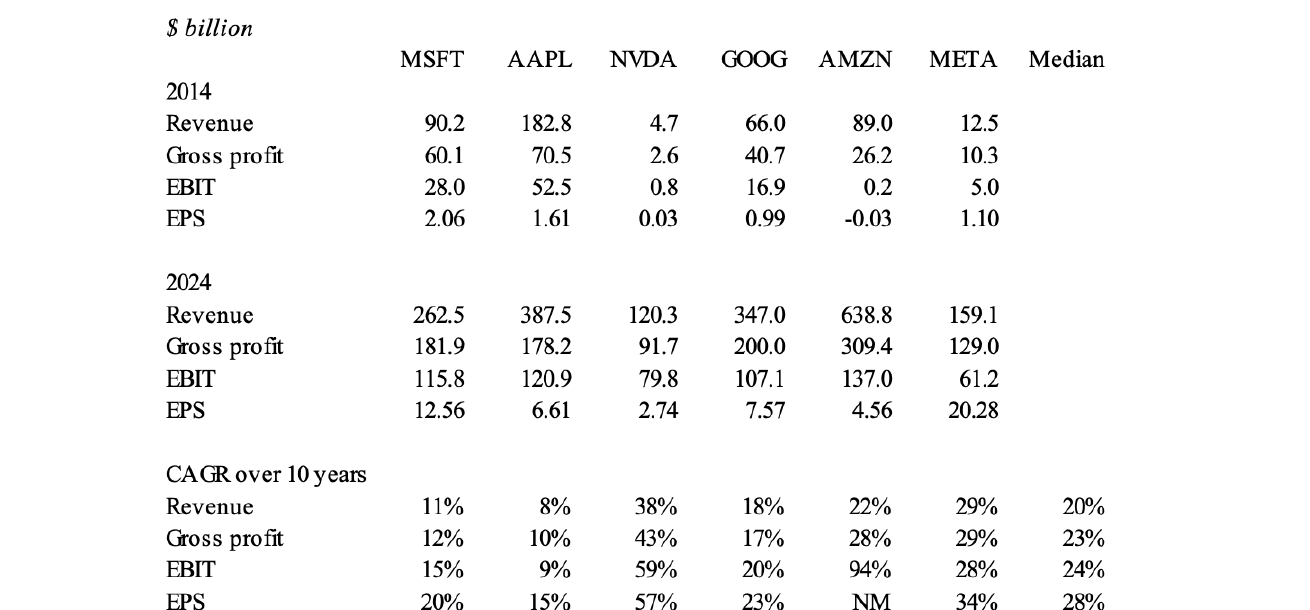
Our view is that the four Eagle owns—Alphabet, Amazon, Meta, and Microsoft—continue to offer attractive returns. Microsoft’s multiple has understandably moved higher as it transitioned its business from a legacy incumbent to a cloud leader. This evolution is well appreciated, and it is correspondingly the smallest of our holdings. The other three have seen their multiples remain stable or move lower. Valuations aren’t elevated. Over the long term, their performance will largely be determined by earnings growth. The runway for these companies is less than it was a decade ago, and we’ve accordingly been adjusting our position sizes.
In terms of the two we don’t own: the prices being paid for Apple and Nvidia seem high. Apple is a mid-single-digit EBIT grower trading at ~30x earnings. It is unlikely to deliver double-digit returns over the next decade. Nvidia is an exciting company, but the range of outcomes is wide. Its customers are investing in GPU capacity well ahead of uncertain end demand. Nvidia’s stock is pricing that this level of spend will not only continue but increase. The further we go in this investment cycle without seeing large proven use cases that enterprises and consumers are willing to pay for, the more exposed Nvidia is to a drastic downturn. It is our view that there are other companies across the market that have similar vulnerabilities.
One of the virtues of the S&P 500 is that it mechanically reweights winners and losers based on the market’s collective wisdom. The flaw with this approach is that the winner-take-most nature of the IP-driven economy, along with investor enthusiasm for technology and growth stocks, is driving extreme crowding. Today, the S&P 500 has approximately 35% of its capital in only 10 companies. This is nearly double the concentration the index has averaged over the past twenty years.
The chart below shows this recent spike in concentration risk and how active U.S. large-cap managers have followed the same path.⁴ The causality runs in both directions. In principle, thoughtful decision-making by active managers sets the relative weights for passive indices. In practice, many managers view “tracking error”—the variance of return relative to a benchmark—as a major business risk, and must buy what’s up and sell what’s down to avoid looking too different from the index. By contrast, Eagle’s concentration is slightly below our historical average and has been declining in recent years.
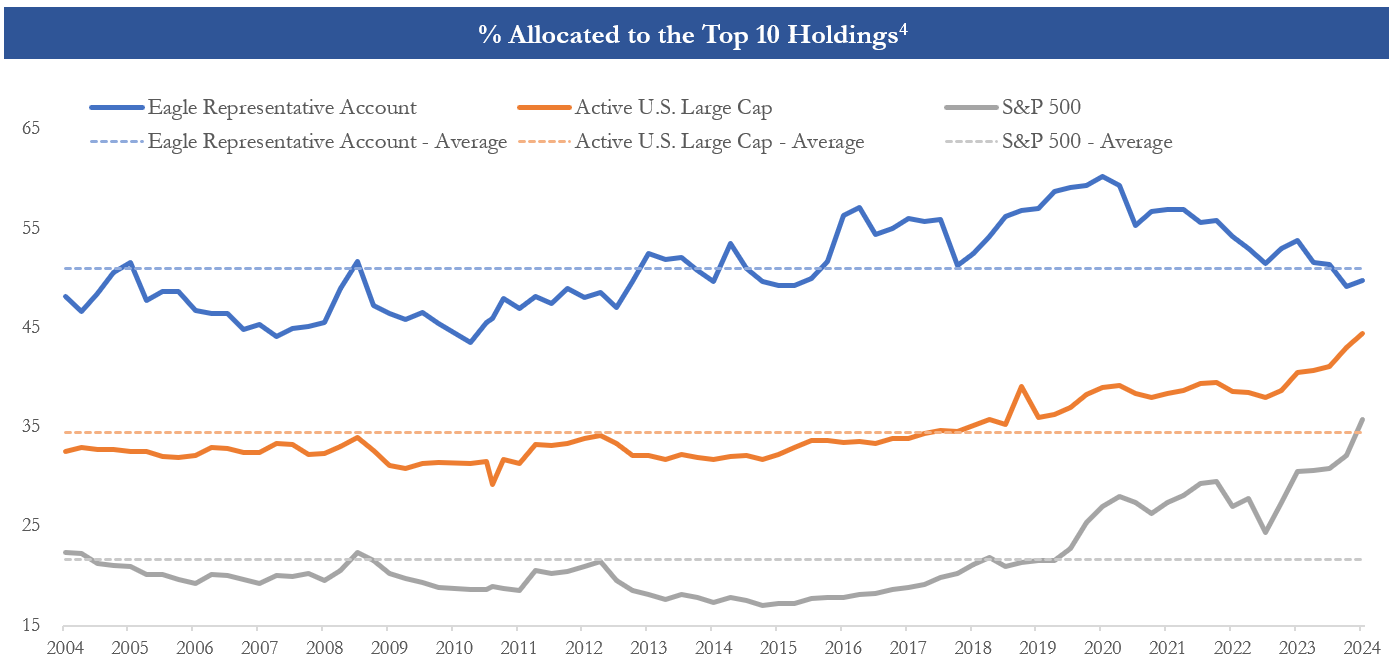
The concentration risk in the S&P 500 is magnified by sector risk. Eight of the top ten companies are in technology. One of the other two is Eli Lilly, which owes most of its market value to the single drug category of GLP-1s. This is a strange complexion for a benchmark that is supposed to reflect a broad and diverse slice of the U.S. economy. By contrast, Eagle’s top ten holdings are made up of four in technology, two in energy, two in healthcare, an insurance broker, and an aerospace firm.
The transformation of the index from a broad mix of the economy to a more concentrated vehicle drives odd risk analytics. For example, Eagle’s tracking error is rising. We feel that Nvidia going up to an extreme weight increases the risk of the S&P 500. But if the S&P 500 is instead defined as the pristine benchmark to measure risk against, then Nvidia rising to an extreme increases Eagle’s risk. This type of thinking reinforces the dynamic of active managers feeling forced to chase what has worked rather than staying focused on finding great future opportunities.
Despite our nitpicks about the index, we think it’s still a good tool. Investors should simply moderate their expectations over the next decade and be aware that the index is riskier than it has historically been. All of this makes it a fascinating time to invest in public markets. For those willing to build a portfolio that looks different, there is lots to do. As always, thanks for your trust and patience as we execute this strategy on your behalf.
As always, if you have any questions or would like to discuss anything herein, please call us at (212) 293-4040. Also, if your financial situation or investment objectives have changed, if your IPO eligibility or U.S. Person status has changed, or if you would like to modify or discuss any investment restrictions or guidelines, please reach out to your contact on the client team or email ClientServices@eaglecap.com.⁵
1 Sources: Advent APX, Bloomberg, Morningstar and Eagle Capital analysis. Past performance is not indicative of future results. All returns are calculated as of calendar year quarter-ends. This table represents the returns of the Eagle Equity Composite (net of fees) and various indices referenced above, for rolling 10-year periods commencing 03/31/1989 (i.e., for the first complete quarterly period following the Eagle Equity Composite’s 12/31/1988 inception date) through 06/30/2024. For the avoidance of doubt, (i) all data for the S&P 500 Equal Weighted Index is specific to the following period: 12/31/1989 (its inception date) through 06/30/2024 and (ii) all data for the Shanghai Composite NR USD is specific to the following period: 12/31/1990 (its inception date) through 06/30/2024. The S&P 500 Index includes approximately 500 leading companies and captures more than three quarters of the total market capitalization. It is float-adjusted and based on the market cap weightings of the securities that comprise the index. The S&P 500 Equal Weighted Index is designed to track the equally weighted performance of the companies in the S&P 500. The Russell 1000 Value Index measures the performance of the large-cap value segment of the U.S. equity universe. It includes those Russell 1000 companies with lower price-to-book ratios and lower forecasted growth values. The Russell 1000 Growth Index measures the performance of the large-cap growth segment of the U.S. equity universe. It includes those Russell 1000 companies with relatively higher price-to-book ratios and higher forecasted growth values. The Shanghai Composite NR USD is a stock market composite made up of all the A-shares and B-shares that trade on the Shanghai Stock Exchange. Returns are in USD and net of withholding tax on foreign dividends. The MSCI Japan NR USD is designed to measure the performance of the large and mid-cap segments of the Japanese market. With 203 constituents, the index covers approximately 85% of the free float-adjusted market capitalization in Japan. Returns are in USD and net of withholding tax on foreign dividends. The MSCI Germany NR USD is designed to measure the performance of the large and mid-cap segments of the German market. With 57 constituents, the index covers about 85% of the equity universe in Germany. Returns are in USD and net of withholding tax on foreign dividends. The MSCI United Kingdom NR USD is designed to measure the performance of the large and mid cap segments of the UK market. With 79 constituents, the index covers approximately 85% of the free float-adjusted market capitalization in the UK. Returns are in USD and net of withholding tax on foreign dividends. In contrast to these indices, the Eagle Equity Strategy is highly concentrated and contains companies not listed in one or more of these indices. Returns for the Eagle Equity Composite are shown net of fees and expenses. Net of fees returns may vary by client. “Minimum” and “maximum” represent, respectively, the lowest and highest returns for any rolling 10-year period within the date range. “Average” is the average return of all rolling 10-year periods within the date range. “10th Percentile” is the point at which 90% of the population had greater outcomes within the date range. “90th Percentile” is the point at which 10% of the population had greater outcomes within the date range. For additional explanatory information, including concerning the performance of the Eagle Equity Composite as it relates to specific 1-, 5- and 10-year periods, see the additional content located at the conclusion of this letter and at eaglecap.com.
Past performance is not indicative of future results. Data is specific to the Eagle Equity Composite. For additional explanatory information, including concerning the performance of the Eagle Equity Composite as it relates to specific 1-, 5- and 10-year periods, see the additional content located at the conclusion of this letter and at eaglecap.com.
2 Sources: Capital IQ and Eagle Capital analysis. This chart reflects the monthly forward P/E ratio of the Eagle Representative Account (excluding cash and cash equivalents) and the S&P 500 Index for the period from 01/31/2014 to 06/30/2024. Forward estimates are based on consensus sell-side earnings estimates over the next twelve months for both the Eagle Representative Account and the S&P 500. The Eagle Representative Account provides a sample snapshot of one Eagle Capital client’s separate account holdings as of a certain date; it does not necessarily represent the holdings of other existing or future Eagle Capital client accounts. The Eagle Representative Account reflects the portfolio of a U.S.-based, non-taxable institutional account without restrictions that deviate from Eagle’s general guidelines. There is no guarantee Eagle will make the same or similar investments in the future. For additional information concerning the Eagle Representative Account, please contact Eagle Capital.
3 Source: Capital IQ. All non-percentile figures are in $B, excluding EPS. As MSFT has a June fiscal year-end, FY2014 / 2015 and FY2024 / 2025 data averages were utilized. As NVDA has a January fiscal year-end, FY2015 and FY2025 data was utilized. Total stock return includes dividend payments.
4 Sources: Morningstar, Advent APX and Eagle Capital Analysis. This chart reflects the historical percentage allocated to the top 10 stocks for the Eagle Representative Account, the S&P 500, and Active U.S. Large Cap fund managers. “Active U.S. Large Cap” refers to the average 1940 Act active fund manager in the Morningstar “U.S. Fund Large Value”, “U.S. Fund Large Growth,” and “U.S. Fund Large Blend” categories. Stocks in the top 70% of the capitalization of the U.S. equity market are defined as large-cap. Large-value funds invest in stocks of big U.S. companies that are less expensive or growing more slowly than other large-cap stocks. Value is defined based on low valuations (low price ratios and high dividend yields) and slow growth (low growth rates for earnings, sales, book value, and cash flow). As of 06/30/2024, Morningstar listed 1,212 funds in the Large Value category. Large-growth funds invest in stocks of big U.S. companies that are projected to grow faster than other large-cap stocks. Growth is defined based on fast growth (high growth rates for earnings, sales, book value, and cash flow) and high valuations (high price ratios and low dividend yields). As of 06/30/2024, Morningstar listed 1,182 funds in the Large Growth category. Large-blend portfolios are fairly representative of the overall U.S. stock market in size, growth rates, and price. The blend style is assigned to portfolios where neither growth nor value characteristics predominate. These portfolios tend to invest across the spectrum of U.S. industries, and owing to their broad exposure, the portfolios' returns are often similar to those of the S&P 500 Index. As of 06/30/2024, Morningstar listed 1,483 funds in the Large Blend category. For more information on the funds included in these categories, please refer to Morningstar’s website: www.morningstar.com. The Eagle Representative Account provides a sample snapshot of one Eagle Capital client’s separate account holdings as of a certain date; it does not necessarily represent the holdings of other existing or future Eagle Capital client accounts. The Eagle Representative Account reflects the portfolio of a U.S.-based, non-taxable institutional account without restrictions that deviate from Eagle’s general guidelines. There is no guarantee Eagle will make the same or similar investments in the future. For additional information concerning the Eagle Representative Account, please contact Eagle Capital. S&P 500 index information is provided for illustrative purposes.
5 Eagle Equity Composite holdings during Q2 2024 were as follows: AA; AER; AMZN; AON; BAYRY; COF; CHTR; CMCSA; COP; DFS; ELV; GE; GEV; GOOG/L; GS; HLT; HUM; LBRDA/K; MAR; META; MSFT; NFLX; OXY; PROSY; SAFRY; SAP; SHEL; TSM; UNH; V; WFC; WWD; and WDAY. The following entities are not currently held in the Eagle portfolio, and reference to these entities is included solely for informational and discussion purposes: Apple, Nvidia and Eli Lilly.
Past performance is not indicative of future results, and there is no assurance that Eagle Capital’s investment objectives will be achieved or that the strategies employed by Eagle Capital will be successful. Except where otherwise indicated, the information contained in this content is based on matters as they exist as of the date of preparation of such material and not as of the date of distribution or any future date. This document does not constitute an offering of advisory services or advice or a recommendation or offer to sell or a solicitation to deal in any security or financial product in any jurisdiction. It is provided for informational purposes only and on the understanding that the recipient has sufficient knowledge and experience to be able to understand and make their own evaluation of the content described herein, any risks associated therewith and any related legal, tax or other material considerations. Recipients should not rely on this material in making any future investment decision. To the extent that the reader has any questions regarding the applicability of any specific issue discussed above to their specific portfolio or situation, clients and prospective investors are encouraged to contact Eagle Capital. Discussions herein relating to risk or any efforts to mitigate risk do not imply that any actions taken by or investment strategies employed by Eagle Capital are in any way low risk or risk free.
This document expresses the views of Eagle Capital as of the date indicated and such views are subject to change without further notice. Eagle Capital has no duty or obligation to update the information contained herein. Certain information contained in this content constitutes “forward-looking statements,” which can be identified by the use of forward-looking terminology such as “may,” “will,” “should,” “expect,” “anticipate,” “project,” “estimate,” “intend,” “continue,” or “believe,” the negatives thereof, other variations thereof or other comparable terminology. Due to various potential risks, uncertainties or actual events, the results or the actual performance of Eagle Capital’s investments may differ materially from those reflected or contemplated in such forward-looking statements.
Any discussion of specific companies contained herein is for informational purposes only and does not represent all of the securities purchased, sold or recommended by Eagle Capital. The reader should not assume that any investments in the securities identified and discussed herein were or will be profitable.
Any index referenced herein is presented because Eagle Capital feels that it serves as a useful point of comparison with aspects of Eagle Capital’s portfolio management.
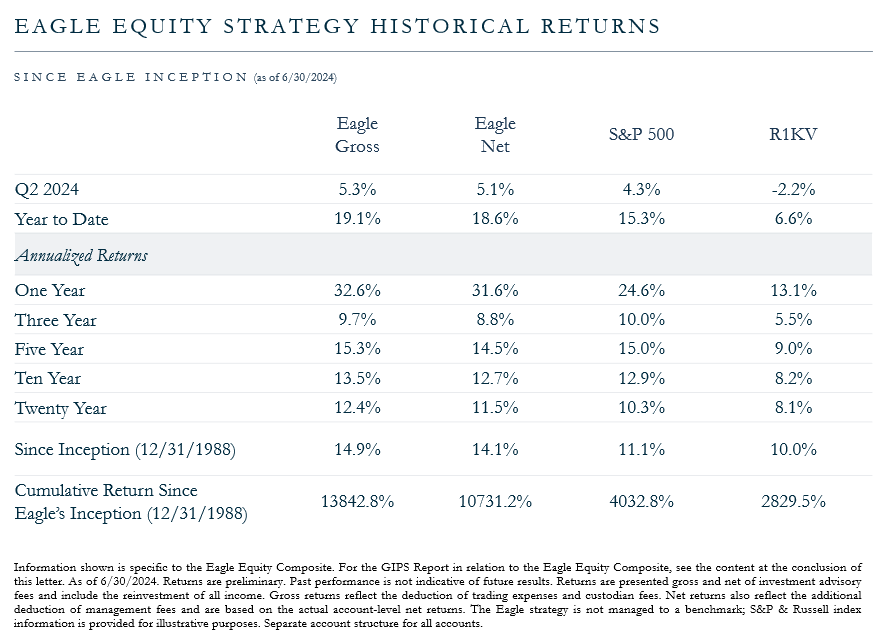
Past performance is not indicative of future results. Information shown is specific to the Eagle Equity Composite. For the GIPS Report in relation to the Eagle Equity Composite, see the content at the conclusion of this letter.
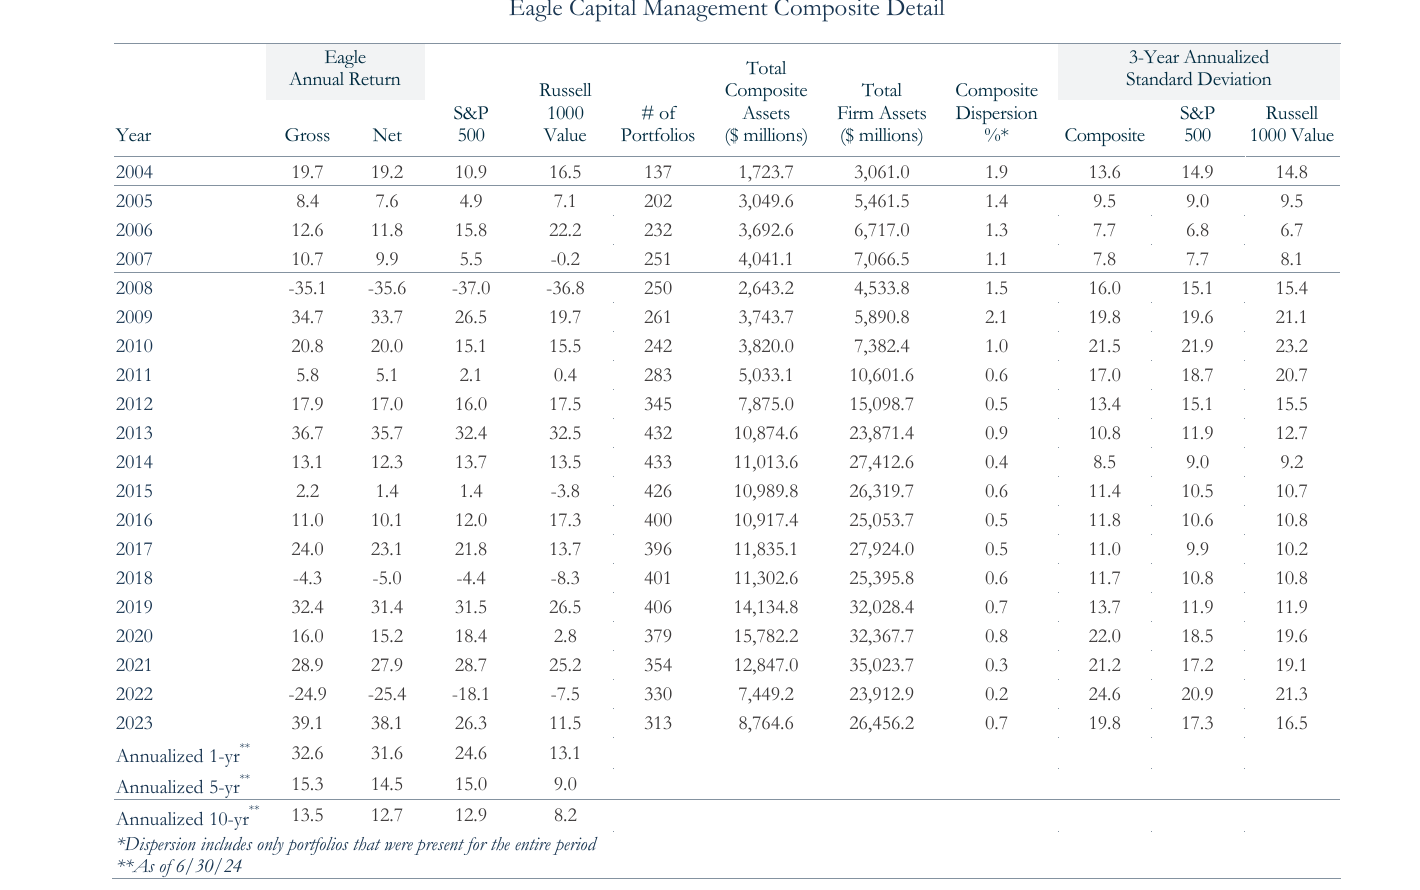
1. Eagle Capital Management, LLC (the “Adviser” or “Eagle”) is an investment adviser registered with the Securities and Exchange Commission. Eagle Capital Management was founded in August 1988 as a corporation. In March 1995, Eagle Capital Management, LLC was formed. Client accounts were transferred at the time of the change and their performance is included in this composite. The Eagle Equity Composite’s inception and creation date is 12/31/1988.
2. Originally, for periods prior to 01/01/1993, Eagle calculated performance utilizing an equal-weighted calculation methodology, and performance reporting included the carved-out equity segment of two balanced portfolios managed to the Eagle Equity Strategy. Each of these carved-out equity segment returns were calculated using an asset-weighted calculation methodology assuming cash holdings equal to 1% of the assets under management of each account. For periods commencing on 01/01/1993, performance was calculated utilizing an asset-weighted calculation methodology. Effective as of 03/08/2021, Eagle began presenting performance for all periods by utilizing an asset-weighted calculation methodology in all instances.
3. The Eagle Equity Composite is defined to include all fee-paying non-taxable discretionary institutional accounts. The term institutional accounts include pension plans, public funds, Taft-Hartley, endowments, foundations, trusts, limited partnerships, and corporate accounts while excluding accounts of natural persons (e.g., IRAs). The minimum initial asset size for a portfolio to be included in the Eagle Equity Composite is $1 million, and institutional accounts included in the Eagle Equity Composite do not apply concentration or similar limits at the portfolio level. If a withdrawal or performance causes a portfolio included in the Eagle Equity Composite to diminish to a level deemed difficult to implement the intended investment strategy, the portfolio may be removed. Members of the Eagle Equity Composite are invested in the Eagle Equity Strategy.
4. The Eagle Equity Strategy is a concentrated, long-only, primarily large-cap equity strategy. The Eagle Equity Strategy invests solely in U.S. traded securities, including ADRs, and generally limits its portfolio holdings to 5% weights at purchase initially and 10% weights at market value. The strategy also generally limits sector exposure to 35% of the portfolio and considers companies with market capitalizations over $3 billion.
5. The Eagle Equity Strategy is not managed to a benchmark. The most common benchmarks chosen by the Adviser’s clients based on its strategy are the S&P 500 Index and the Russell 1000 Value Index which are included above. The S&P 500 Index includes 500 leading companies and captures more than three-quarters of the total market capitalization. It is float-adjusted and based on the market cap weightings of the securities that comprise the index. The Russell 1000 Value Index measures the performance of the large-cap value segment of the U.S. equity universe. It includes those Russell 1000 companies with relatively lower price-to-book ratios and lower forecasted growth values. The Russell 1000 Growth Index, which is not shown, is also chosen by the Adviser’s clients based on the strategy and is available upon request. The Russell 1000 Growth Index measures the performance of the large-cap growth segment of the U.S. equity universe. It includes those Russell 1000 companies with relatively higher price-to-book ratios and higher forecasted growth values. In contrast, the Eagle Equity Strategy is highly concentrated and may contain companies not listed in these indices.
6. Every fee-paying discretionary account is included in one composite up to and including the last month it is fully invested. Composite information is not representative of any individual client account. New portfolios are excluded from composites until deemed fully invested. Portfolios no longer under management are included in historical composites for the periods they were under management; they are excluded for all periods after the last full month they were in place. Descriptions of composites, limited distribution pooled funds, and broad distribution pooled funds are available upon request. In addition, policies for valuing investments, calculating performance, and preparing GIPS Reports are available upon request.
7. Do not assume that all transactions will be profitable or that future performance is in any way guaranteed by past results. Performance calculations are on a time-weighted and asset-weighted total return basis and reflect reinvestment of dividends and other earnings. Trade-date accounting valuation is used, and income is accrued. Returns from client to client will vary slightly depending on portfolio size, diversification, and transaction costs. In the process of active portfolio management, short-term investments may be held in portfolios pending investment. Product descriptions in this brochure should not be construed to mean that cash is immediately invested.
8. The Adviser’s standard annual asset-based management fee schedule is 1% of the account’s total assets on the first $5 million and 0.75% thereafter. Gross performance results are net of commissions but do not reflect the deduction of Eagle’s investment advisory fee, which will affect a client’s total return. Net returns are net of trading expenses (commissions), bank fees, foreign withholdings taxes, and Eagle’s actual investment advisory fee. The performance presented does not represent the return of any one individual investor. The current presentation may differ from previous presentations of historical data due to differences in assumptions, material market conditions, and estimates used to calculate the performance. An individual client account’s net return may differ significantly due to differences in fees, brokerage charges, other commissions, and/or any other expenses paid and the account’s date of inception. Additional information related to the fees charged by the Adviser can be found in its Form ADV Part 2 or in the respective Investment Management Agreement.
9. The currency used to express performance is the U.S. dollar.
10. Internal gross composite dispersion is calculated using the gross asset-weighted standard deviation of annual gross returns of those portfolios that were included in the composite for the entire year.
11. The three-year annualized gross standard deviation measures the variability of the composite and benchmark monthly returns over the previous 36-month period.
12. Eagle Capital Management, LLC claims compliance with the Global Investment Performance Standards (GIPS®) and has prepared and presented this report in compliance with the GIPS standards. Eagle Capital Management, LLC has been independently verified for the periods 01/01/1993 through 12/31/2023. A firm that claims compliance with the GIPS standards must establish policies and procedures for complying with all the applicable requirements of the GIPS standards. Verification provides assurance on whether the firm’s policies and procedures related to composite and pooled fund maintenance, as well as the calculation, presentation, and distribution of performance, have been designed in compliance with the GIPS standards and have been implemented on a firm-wide basis. The Eagle Equity Composite has had a performance examination for the periods 01/01/1993 through 12/31/2023. The verification and performance examination reports are available upon request.
13. A more detailed description of the assumptions utilized in any of the simulations, models, and/or analyses contained in this report is available upon request. Eagle does not represent that the information contained herein is accurate or complete, and it should not be relied upon as such; Eagle does not undertake any obligation to update the information contained herein. Recipients should not rely on this material in making any investment decision. This document does not constitute advice or a recommendation or offer to sell or a solicitation of any offer to buy any security.
GIPS® is a registered trademark of CFA Institute. CFA Institute does not endorse or promote this organization, nor does it warrant the accuracy or quality of the content contained herein.
Q2 2024 Letter: Rethinking the S&P 500 | Eagle Capital Management
The S&P 500 has long been a dominant force in investing, but its recent high valuations and growing concentration risk raise important questions about its futur