Eagle’s performance was positive during the quarter, resisting declines in the overall market.¹ In contrast to the first half of the year, the Magnificent Seven was also down. As many have noted, this group of large technology companies is responsible for a disproportionate share of 2023’s market performance. Through the first nine months of the year, the S&P 500 index was up 13.0% as compared to only 1.7% for the S&P 500 Equal-weighted index. So, while the market average has had a respectable year, the average stock has lagged money-market yields.
Some of you have asked if the worm is turning and how Eagle thinks about these large companies. Eagle holds four: Microsoft, Alphabet, Amazon, and Meta. Despite having a concentrated portfolio, we have a modestly lower weighting of the Magnificent Seven than the S&P 500 does. How the overall group performs isn’t currently an important driver of Eagle’s relative performance. Because our North Star is compounding long-term absolute returns, we don’t decide to own, or avoid, stocks based on their index weighting.
We continue to like these four investments and believe they offer attractive returns in highly advantaged business models. However, strong performance this year has pulled some of that forward, and Eagle has trimmed from these positions to manage our sizing and to recycle capital into other opportunities.
We aren’t fans of the Magnificent Seven categorization because it oversimplifies reality. What these companies have in common is that they are massive technology leaders and are up a lot this year. But they have important differences. Apple is dominant in selling highly differentiated electronic devices to consumers. Most of Microsoft’s earnings come from selling software and services to businesses. Amazon Web Services competes with Microsoft, but Amazon’s retail segment looks more like Walmart than any of the other six. NVIDIA makes semiconductors and systems. Alphabet and Meta have similar digital advertising businesses, but their consumer products significantly differ. Finally, Tesla manufactures cars.
The name itself is silly. It didn’t exist a year ago because there was nothing magnificent about the performance of several of these stocks. A few years from now, the category will likely disappear as quickly as it has emerged. Over the next decade, we expect some of these companies will widen their moats, expand their customer offerings, and drive strong shareholder returns. Others may stumble and find their profit pools competed down. Individual company dynamics will matter more than being part of a club.
Over the past 16 months, Eagle built positions in three energy stocks: ConocoPhillips, Shell, and Occidental Petroleum (“Oxy”). Our investments performed well during the quarter, and we believe the long-term opportunity is underappreciated.
Our thesis has three aspects. First, the long-term supply and demand balance for oil is attractive. Second, the companies we own have quality, long-duration assets that are well-positioned on the global cost curve. Finally, the management teams we’re backing are allocating capital well and in alignment with shareholders.
The first paradox of energy investing is that the long-term bear case on demand growth, electric vehicles, is critical to our bullish view. Electric vehicles will almost certainly become a large part of the global fleet over the coming decades, which will significantly reduce gasoline, and eventually diesel, demand. This headwind is clear, vivid, and decisive. As a result, it is depressing supply-side energy investment before the world is ready.
The best predictor of future commodity prices and commodity firms’ returns on capital is how much capital is currently being invested. Too much supply growth drives low future prices and poor returns. The inverse is also true.
U.S. oil production first peaked at just under 10 million barrels per day (“mmbbl/d”) in 1970. By 2008 it stood at 5mmbbl/d. Over the next 15 years, the development of U.S. shale enabled production to grow to roughly 13mmbbl/d—a feat comparable to bringing on another Saudi Arabia or Russia. This new technology had an exciting growth story, which management teams and investors enthusiastically funded. It ended in disaster for shareholders. This 15-year period of spectacular growth translated to the U.S. E&P industry underperforming the S&P 500 by 10.3% annually and 271% cumulatively.
Supply investment is now subdued. The pressure from shareholders, regulators, and environmental groups is overwhelmingly in one direction. Management teams have been replaced or cowed. Shale growth is geologically played out. Every shale oil basin except for the Permian has plateaued, and productivity trends there are softening. The lower 48 has a few more years of growth before it flattens. There are available deepwater projects such as Exxon’s play off the coast of Guyana. Here, however, the long-term demand overhang from electric vehicles comes into play. Publicly traded oil companies, owned by shareholders who fear a future bust, are wary of investing in these massive, long-cycle projects. The return threshold required has increased, and the assumption used for future oil prices has decreased.
Decline rates are a critical aspect of the oil market. Unlike a steel factory, which can produce the same amount of steel year after year, oil production drops if new capex isn’t spent. Globally, the decline rate is estimated at 8% annually. To meet average oil demand growth of +1%, the creation of new supply needs to be 9% annually.
Even when oil demand shifts into secular decline, we will still need to invest in capex for decades to come. If oil demand eventually slows from +1% to -1%, annual supply replacement will need to shrink from 9% of global supply to 7%. This 22% reduction in capex is significant, but hardly catastrophic. Global exploration and development capex is already 7% below the 15-year average in nominal terms and 26% below in real terms. This is striking given that oil production is 7% above the 15-year average, meaning that capex per flowing barrel has declined even more.
Moreover, it’s unlikely that we will get to -1% per year any time soon. Gasoline and diesel combine for approximately 50% of oil demand. The balance comes from petrochemicals, jet fuel, and a mix of other categories. Collectively, this other 50% is likely to have positive demand for decades to come. The opportunity to replace demand is with automotive transportation fuels. But even this is more challenging than it first appears.
Over the 12 years when EV sales penetration in Norway went from 0 to 84%, its gasoline and diesel consumption fell by only 0.9% annually. EV penetration describes upfront sales, but with the average car lasting for 200,000 miles, the fuel consumption mix of the entire fleet transitions with a long lag. The International Energy Agency (“IEA”) projects that EV penetration for new vehicles sold will grow from 14% in 2022 to 35% in 2030. The IEA has tended to be overly pessimistic about oil demand; even so, this trajectory is slow. Our best estimate is that China will convert faster than the IEA forecasts and that the U.S. will move more slowly. The overall forecast is reasonable and correspondingly implies a long and gradual decline in oil demand as a transport fuel.
The bottom line is that supply has already adjusted to expect a more pessimistic demand future. Rather than electric vehicles representing a risk to oil prices, any disappointment in their uptake may represent upside.
The second paradox of energy investing is that the very fact that the stocks are often used as trading sardines for the price of oil, means a long-duration approach can differentially capitalize on company-specific research. It is critical to analyze the resource holdings and inventory length among various producers. There are wide differences.
For an investor who owns an energy stock to express a short-term view on the price of oil, it matters little whether the company owns 10 years of drilling inventory or 30 years. For Eagle, it matters greatly. Shorter inventory positions cause geological headwinds to emerge more rapidly, which results in some combination of declining production, lower margins, or pricey acquisitions. Recent acquisitions by Exxon and Chevron reflect, in part, that those firms don’t have the growth runway they would like.
ConocoPhillips and Oxy have privileged low-cost inventory positions that enable growth over the next decade, followed by a long plateau. Shell’s upstream production won’t grow as much as our other investments, but it is transitioning to more deepwater, high-margin barrels. In addition, its liquid natural gas segment (“LNG”) is the global leader and has growth opportunities for years to come.
The third paradox of energy investing is that partnering with the right management teams is even more critical in capital-intensive industries than it is for traditionally great business models. The most important job of a CEO is to allocate capital. Capital-intensive businesses, such as energy production, place additional weight on the quality of decision-making along this vector.
This is easy to see with a math exercise. ConocoPhillips generated $24.6 billion of cash from operations over the past year. Management must decide where to allocate this between capex to extend its production, share buybacks, acquisitions, and dividends. The market cap of the firm is $140 billion, so management makes capital allocation decisions that correspond to the entire value of the company every 5-6 years. Shell’s higher capital intensity and cheaper valuation means that management is allocating value even more rapidly, over only 3-4 years. Contrast these with Visa, another Eagle holding. Visa is an excellent business with strong management. However, its capital-light model and higher valuation mean that it would take 22 years for management to allocate the company’s market cap. There is less leverage for management teams to add or destroy value through their decisions.
History supports this framework. Over the past decade, annual stock performance for Visa and Mastercard was 17.2% and 18.3%, a minor difference. By contrast, ConocoPhillips compounded at 8.1% annually compared to -5.3% for the overall S&P E&P Index, and investors in the company turned $100 into $219. Investing in a weighted basket of energy companies to get the “average” would have left them with only $58, an almost four-fold difference in outcome. Imagine what ConocoPhillips might do over the coming decade if the wind is at its back instead of in its face.
ConocoPhillips’s CEO has been in place since 2012. During the shale bubble, management was more cautious than many peers and didn’t drive the firm off a cliff. In the depths of the downturn, ConocoPhillips was able to make opportunistic acquisitions from motivated sellers. Now, when peers are more cautious, the company continues to judiciously manage its shale production while also investing in long-cycle projects such as Willow, Alaska.
Shell and Oxy each have checkered pasts. However, Shell’s new leadership is highly focused on return on capital and better maximizing the value of its assets. Oxy’s management, no doubt influenced by its 26% shareholder Berkshire Hathaway, is deploying its prodigious free cash flow into redeeming its preferred securities and buying back stock.
On average, our three holdings returned almost 11% of their market caps to shareholders over the past year. Over the coming 5-10 years, we expect an attractive combination of modest production growth and significant ongoing cash distributions.
The fourth paradox of energy investing is that these stocks, despite being perceived as deep cyclicals, may reduce portfolio risk. For much of the last 40 years, energy stocks usually acted as a multiplier on portfolio returns. When the economy was strong, oil demand did well, and stocks followed. When economies weakened, oil prices correspondingly suffered. As we look ahead to a world that is more supply-constrained, the relationships will change.
Oil-driven supply shocks may occur more frequently and violently. Rather than energy moving in tandem with the economy, it may episodically put the brakes on GDP growth. We saw this dynamic last year with the Russia-Ukraine war. Now, risk in the Middle East appears to be growing. In these scenarios, energy may protect against the pressure we will face in other parts of our portfolio.
Over a decade ago, Eagle began investing in internet companies that investors, scarred by the tech bubble, had sworn off. The businesses and valuations had improved, but perceptions lagged. Today, energy stocks are unloved and not widely owned despite attractive long-term fundamentals and optionality. The group accounts for only 4.5% of the S&P 500 but generates nearly double that as a percentage of earnings. Moreover, ongoing cash distributions to shareholders in the form of buybacks and dividends cause its weighting to shrink daily. The sector has performed poorly over 1, 5, 10, and 20 year time horizons. We think the future will look different.
As always, if you have any questions or would like to discuss anything herein, please call us at (212) 293-4040. Also, if your financial situation or investment objectives have changed, if your IPO eligibility or U.S. Person status has changed, or if you would like to modify or discuss any investment restrictions or guidelines, please reach out to your contact on the client team or email ClientServices@eaglecap.com.²
1 As more specifically outlined in the additional content located at the conclusion of this letter, for the Q3 2023 period the Eagle Equity Composite returned 0.7% net of fees. During this same period, the S&P 500 Index returned -3.3% and the Russell 1000 Value Index returned -3.2%. For the avoidance of doubt, this additional content references the performance of the Eagle Equity Composite as it relates to specific 1-, 5- and 10-year periods. Past performance is not indicative of future results.
2 Eagle Equity Composite holdings during Q3 2023 were as follows: AER; AMZN; AON; BAYRY; COF; CHTR; C; CMCSA; COP; DISH; ELV; GE; GOOG/L; GS; HLT; IAC; LBRDA/K; MAR; META; MS; MSFT; NFLX; NPSNY; OXY; PROSY; SAFRY; SAP; SHEL; UNH; V; WFC; and WWD. The following entities are not currently held in the Eagle portfolio, and reference to these entities is included solely for informational and discussion purposes: Apple, Walmart, NVIDIA, Tesla, Exxon, Chevron and Mastercard.
Past performance is not indicative of future results, and there is no assurance that Eagle Capital’s investment objectives will be achieved or that the strategies employed by Eagle Capital will be successful. Except where otherwise indicated, the information contained in this content is based on matters as they exist as of the date of preparation of such material and not as of the date of distribution or any future date. This document does not constitute an offering of advisory services or advice or a recommendation or offer to sell or a solicitation to deal in any security or financial product in any jurisdiction. It is provided for informational purposes only and on the understanding that the recipient has sufficient knowledge and experience to be able to understand and make their own evaluation of the content described herein, any risks associated therewith and any related legal, tax or other material considerations. Recipients should not rely on this material in making any future investment decision. To the extent that the reader has any questions regarding the applicability of any specific issue discussed above to their specific portfolio or situation, clients and prospective investors are encouraged to contact Eagle Capital. Discussions herein relating to risk or any efforts to mitigate risk do not imply that any actions taken by or investment strategies employed by Eagle Capital are in any way low risk or risk free.
This document expresses the views of Eagle Capital as of the date indicated and such views are subject to change without further notice. Eagle Capital has no duty or obligation to update the information contained herein. Certain information contained in this content constitutes “forward-looking statements,” which can be identified by the use of forward-looking terminology such as “may,” “will,” “should,” “expect,” “anticipate,” “project,” “estimate,” “intend,” “continue,” or “believe,” the negatives thereof, other variations thereof or other comparable terminology. Due to various potential risks, uncertainties or actual events, the results or the actual performance of Eagle Capital’s investments may differ materially from those reflected or contemplated in such forward-looking statements.
Any discussion of specific companies contained herein is for informational purposes only and does not represent all of the securities purchased, sold or recommended by Eagle Capital. The reader should not assume that any investments in the securities identified and discussed herein were or will be profitable.
Any index referenced herein is presented because Eagle Capital feels that it serves as a useful point of comparison with aspects of Eagle Capital’s portfolio management. The S&P 500 Index includes 500 leading companies and captures more than three quarters of the total market capitalization. It is float-adjusted and based on the market cap weightings of the securities that comprise the index. In contrast, the Eagle Equity Strategy is highly concentrated and may contain companies not listed in the S&P 500 Index. The Russell 1000 Value Index contains those Russell 1000 companies that have higher book-to-price ratios, and thus a less-than-average growth orientation, than the remaining companies in the Russell 1000 Index that encompass the Russell 1000 Growth Index. In contrast, the Eagle Equity Strategy is highly concentrated and may contain companies not listed in the Russell 1000 Value Index.
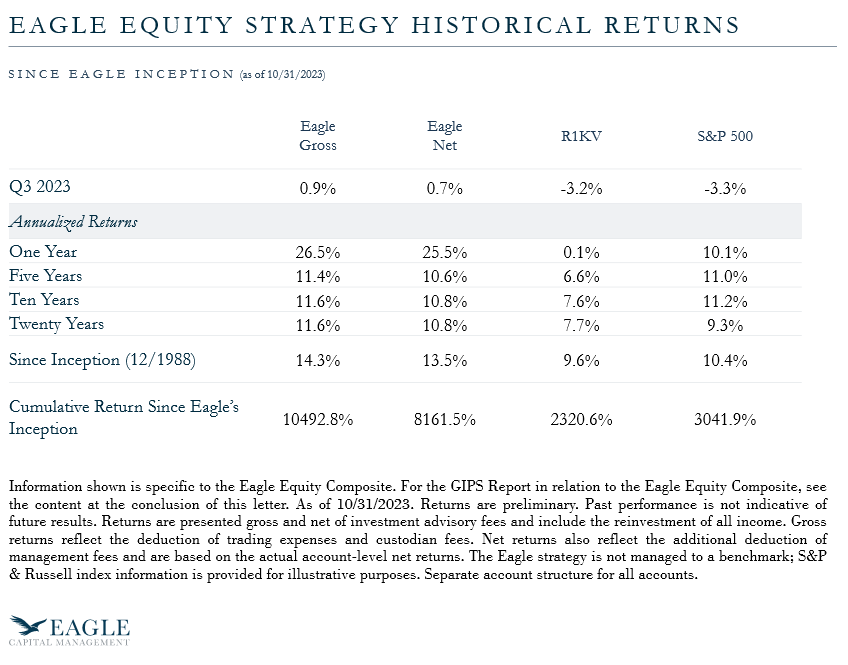
Past performance is not indicative of future results. Information shown is specific to the Eagle Equity Composite. For the GIPS Report in relation to the Eagle Equity Composite, see the content at the conclusion of this letter. As of 10/31/2023. Returns are preliminary. Returns are presented gross and net of investment advisory fees and include the reinvestment of all income. Gross returns reflect the deduction of trading expenses and custodian fees. Net returns also reflect the additional deduction of management fees and are based on the actual account-level net returns. The Eagle strategy is not managed to a benchmark; S&P & Russell index information is provided for illustrative purposes. Separate account structure for all accounts.
1. Eagle Capital Management, LLC (the “Adviser”) is an investment adviser registered with the Securities and Exchange Commission. Historically, Eagle Capital calculated its performance for periods prior to 01/01/1993 utilizing an equal weighted calculation methodology, whereas for periods commencing on 01/01/1993 performance was calculated utilizing an asset-weighted calculation methodology. Effective as of 03/08/2021, Eagle Capital began presenting performance for all periods by utilizing an asset-weighted calculation methodology in all instances. For periods prior to 01/01/1993, performance reporting includes the carved-out equity segment of two balanced portfolios managed to the Eagle Equity Strategy. These carved-out equity segment returns are calculated using an asset-weighted calculation methodology assuming cash holdings equal to 1% of the AUM of each account.
2. Eagle Capital Management was founded in August 1988 as a corporation. In March 1995, Eagle Capital Management, LLC was formed. Client accounts The Eagle Equity Composite’s inception date is 12/31/1988. The Eagle Equity Composite is made up of all fee paying tax-free discretionary institutional accounts over $1 million.
3. All fee-paying, discretionary portfolios are included in at least one composite. Composite information is not representative of any individual client account. New portfolios are excluded from composites until deemed fully invested. Portfolios no longer under management are included in historical composites for the periods they were under management; they are excluded for all periods after the last full month they were in place. No leveraged and non-fee paying accounts are included in the Eagle Equity Composite. A list of composite descriptions, limited distribution pooled fund descriptions, and a list of broad distribution pooled funds are available upon request. In addition, policies for valuing investments, calculating performance, and preparing GIPS reports are available upon request. The minimum asset size for a portfolio to be included in the Eagle Equity Composite is $1,000,000, and institutional accounts included in the Eagle Equity Composite do not apply concentration or similar limits at the portfolio level. If withdrawal or performance causes a portfolio included in the Eagle Equity Composite to diminish to a level deemed difficult to implement the intended investment strategy, the portfolio is removed. When taxes are considered, the performance may vary.
4. Do not assume that all transactions will be profitable or that future performance is in any way guaranteed by past results. Performance calculations are on a time-weighted and asset-weighted total return basis and reflect reinvestment of dividends and other earnings. Trade-date accounting valuation is used and income is accrued. Returns from client to client will vary slightly depending on portfolio size, diversification and transaction costs. The equity portion of balanced accounts was included in the Eagle Equity Composite until the first quarter of 1994. In the process of active portfolio management, cash may be held in portfolios pending investment. Product descriptions in this brochure should not be construed to mean that cash is immediately invested.
5. The Firm’s standard annual asset based management fee schedule is 1% of the account’s total assets on the first $5,000,000 and 0.75% thereafter. Gross performance results is net of commissions but does not reflect the deduction of Eagle’s investment advisory fee, which will affect a client’s total return. Net returns are net of trading expenses (commissions), bank fees, foreign withholdings taxes and Eagle’s actual investment advisory fee. The performance presented does not represent the return of any one individual investor. The current presentation may differ from previous presentation of historical data due to differences in assumptions, material market conditions and estimates used to calculate the performance. An individual client account’s net return may differ significantly due to differences in fees, brokerage or other commissions, and/or any other expenses paid and the account’s date of inception. Additional information related to the fees charged by Eagle can be found in its Form ADV Part 2 or in the respective Investment Management Agreement.
6. The currency used to express performance is the U.S. dollar.
7. The Eagle Equity Composite is defined to include all fee-paying non-taxable, institutional accounts. The term institutional accounts include pension plans, public funds, Taft-Hartley, endowments, foundations, trusts, limited partnerships, and corporate accounts while excluding accounts of natural persons (e.g., IRAs). The Eagle Equity Composite has an initial account value minimum of $1,000,000.00. Members of the Eagle Equity Composite are invested in the Eagle Equity Strategy. The Eagle Equity Strategy is not managed to a benchmark. The benchmarks most commonly chosen by our clients based on our Strategy are the S&P 500 and the Russell 1000 Value indices. The S&P 500 Index includes 500 leading companies and captures more than three quarters of the total market capitalization. It is float-adjusted and based on the market cap weightings of the securities that comprise the index. In contrast, the Eagle Equity Strategy is highly concentrated and may contain companies not listed in the S&P 500 Index. The Russell 1000 Value Index contains those Russell 1000 companies that have higher book-to-price ratios, and thus a less-than-average growth orientation, than the remaining companies in the Russell 1000 Index that encompass the Russell 1000 Growth Index. In contrast, the Eagle Equity Strategy is highly concentrated and may contain companies not listed in the Russell 1000 Value Index.
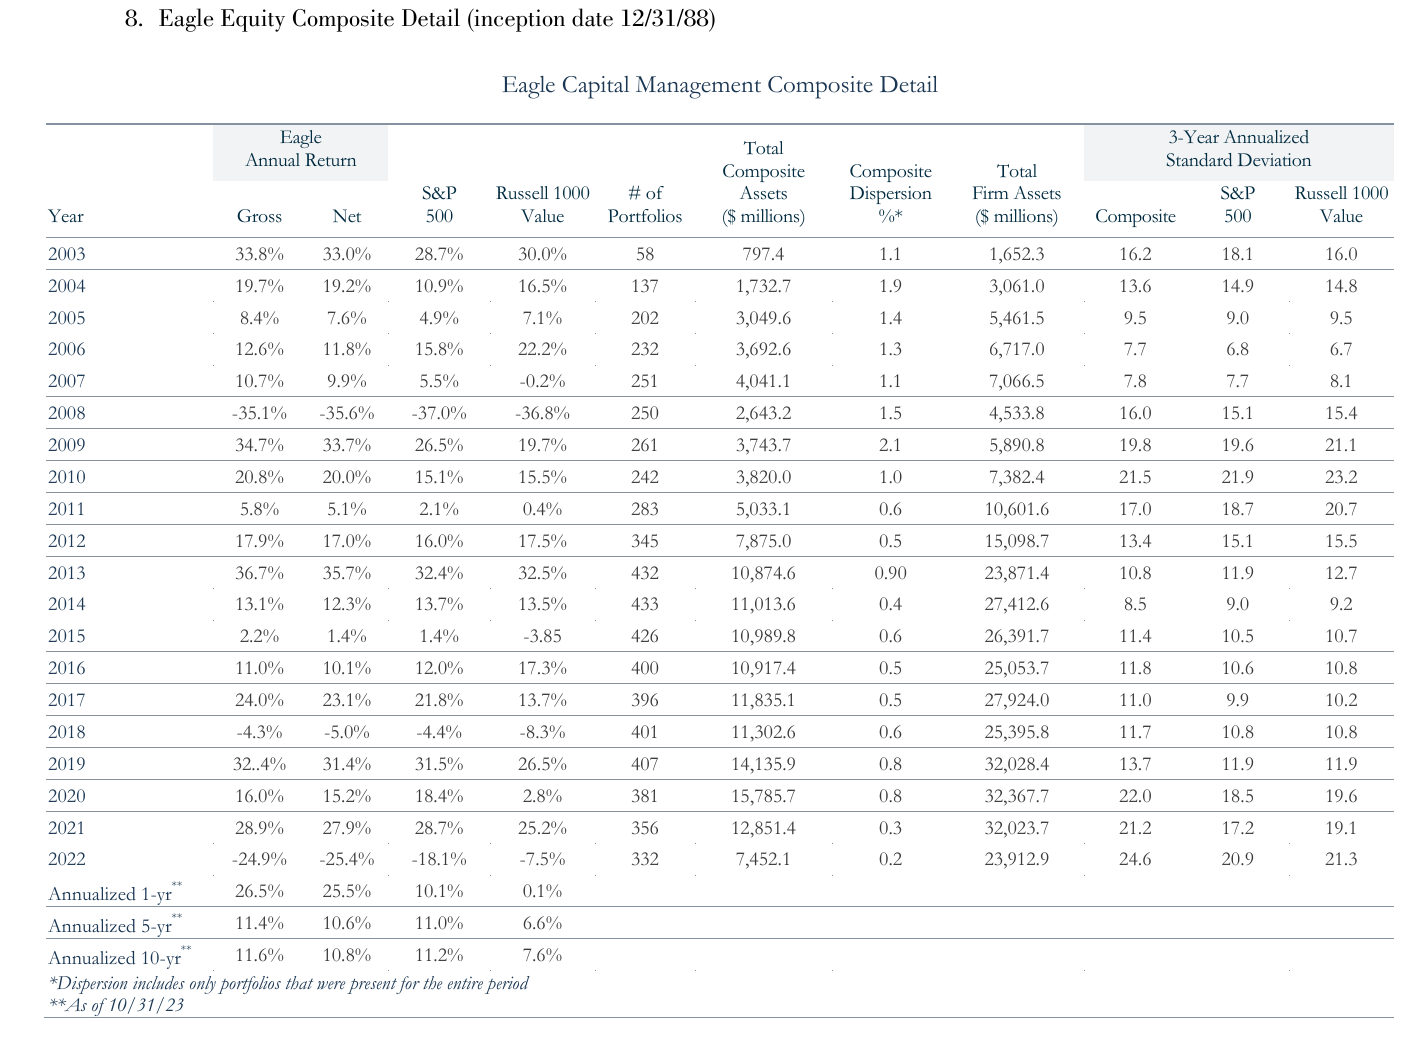
8. Eagle Equity Composite Detail (inception date 12/31/1988) — see table figure above.
The Eagle Equity Strategy is a concentrated, long-only, primarily large-cap equity strategy. The Eagle Equity Strategy invests solely in U.S. traded securities, including ADRs, generally limits its portfolio holdings to 5% weights at purchase initially and 10% portfolio weights at market value. The strategy also generally limits sector exposure to 35% of the portfolio. The firm considers companies with market capitalizations in excess of $3 billion. The composite creation date was 12/31/1988.
Internal gross composite dispersion is calculated using the gross asset-weighted standard deviation of annual gross returns of those portfolios that were included in the Composite for the entire year.
The three-year annualized gross standard deviation measures the variability of the composite and benchmark monthly returns over the previous 36-month period.
Eagle Capital Management, LLC claims compliance with the Global Investment Performance Standards (GIPS®) and has prepared and presented this report in compliance with the GIPS standards. Eagle Capital Management, LLC has been independently verified for the periods 01/01/1993 through 12/31/2022. A firm that claims compliance with the GIPS standards must establish policies and procedures for complying with all the applicable requirements of the GIPS standards. Verification provides assurance on whether the firm’s policies and procedures related to composite and pooled fund maintenance, as well as the calculation, presentation, and distribution of performance, have been designed in compliance with the GIPS standards and have been implemented on a firm-wide basis. The Eagle Equity Composite has had a performance examination for the periods 01/01/1993 through 12/31/2022. The verification and performance examination reports are available upon request. A more detailed description of the assumptions utilized in any of the simulations, models, and/or analyses contained in this report is available upon request. Eagle does not represent that the information contained herein is accurate or complete, and it should not be relied upon as such; Eagle does not undertake any obligation to update the information contained herein. Recipients should not rely on this material in making any investment decision. This document does not constitute advice or a recommendation or offer to sell or a solicitation of any offer to buy any security.
GIPS® is a registered trademark of CFA Institute. CFA Institute does not endorse or promote this organization, nor does it warrant the accuracy or quality of the content contained herein.
Q3 2023 Letter: Capitalizing on… | Eagle Capital Management
Eagle navigated market turbulence with persistence, strategically managing its technology holdings and making energy investments that challenge conventional wis