Eagle celebrated its 35th anniversary in December. As partners on this journey, we’re grateful for your trust. 2023 was a strong year, but over the past four decades we’ve had plenty of weak ones too. In the short term, markets can do just about anything. Your steadfast support helps us stay singularly focused on generating excellent long-term returns.
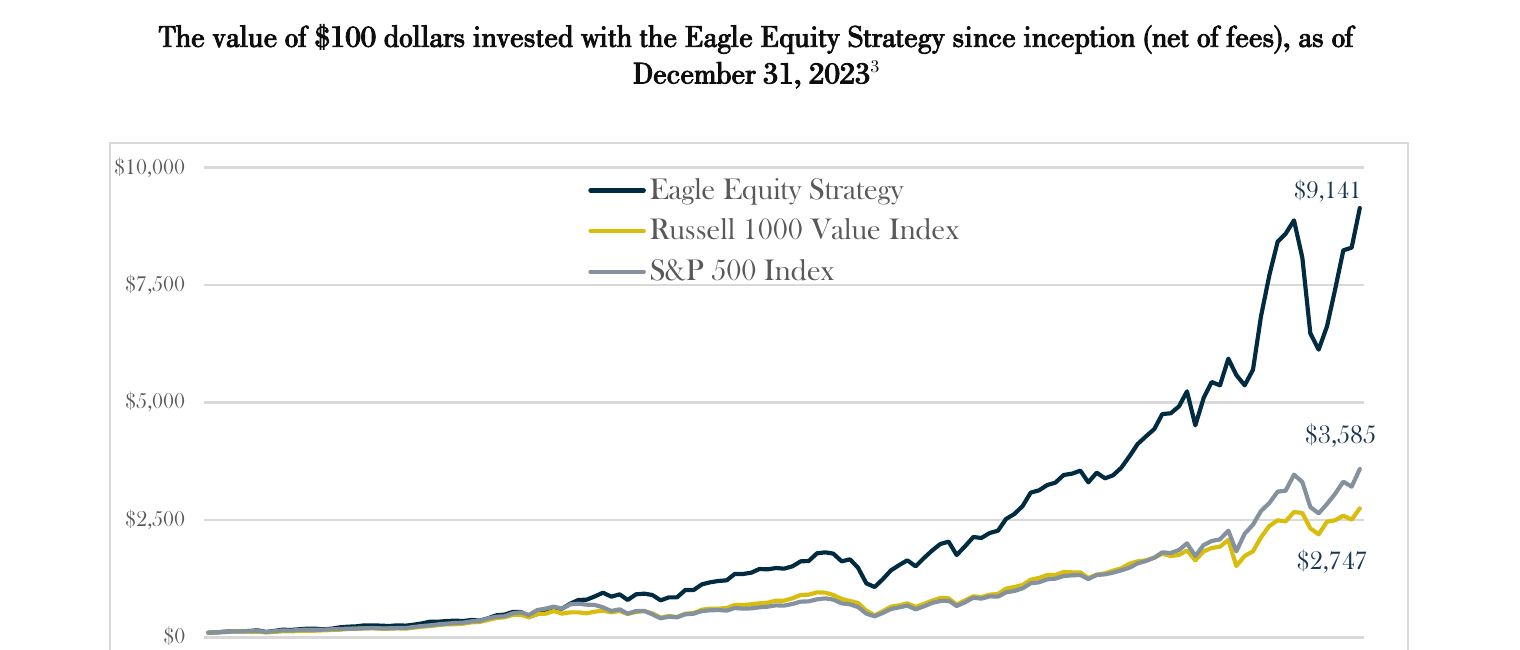
Eagle’s long-term results have been significantly better than the market averages, showing higher returns and lower risk of capital impairment. Since its inception in 1988, the strategy has compounded at 13.8% annually, compared to 10.8% for the S&P 500 and 9.9% for the Russell Value.1 Over time, this has driven a substantial cumulative advantage.
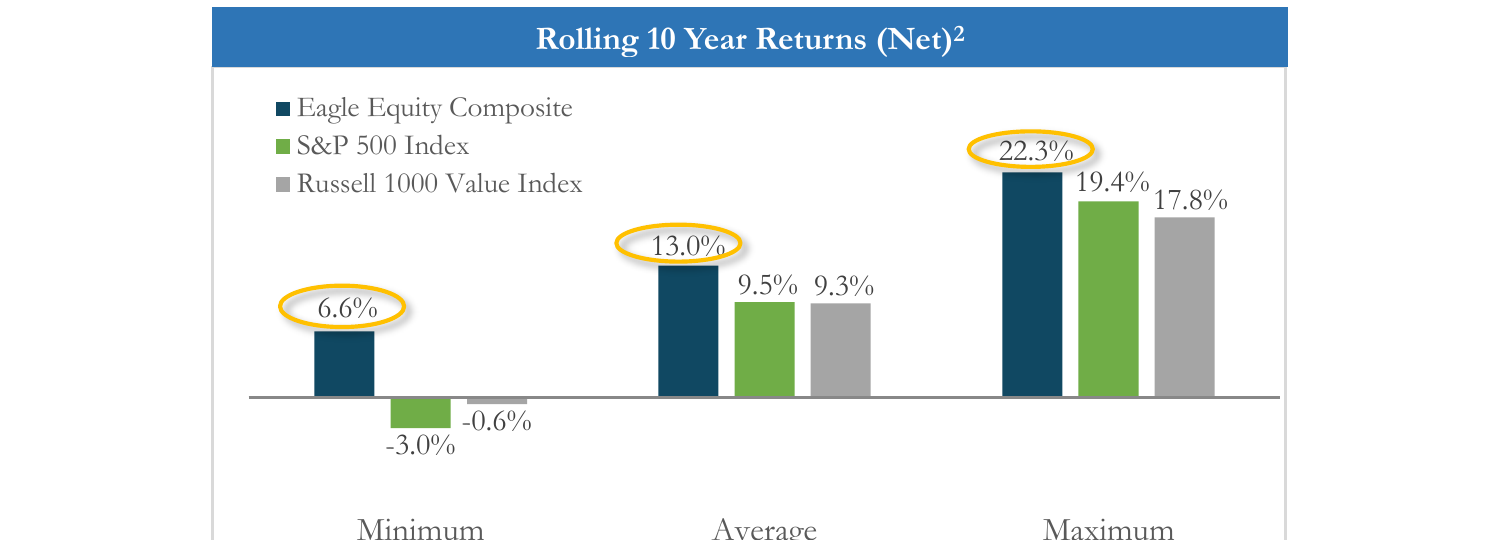
Of course, few clients were with us in 1988. Fortunately, Eagle’s strategy has been durable, making clients’ experience based on their starting point less subject to chance. On average, investing at any time in Eagle’s history and holding the strategy for ten years has generated 13.0% annually. This compares with 9.5% or 9.3% for the S&P 500 and Russell Value. Even more important is consistency. Over Eagle’s worst 10-year period, clients achieved 6.6% annually. By contrast, over their worst 10-year periods, the S&P 500 and the Russell Value delivered annual returns of -3.0% and -0.6%, respectively.
Wall Street loves complicated risk and reward metrics. Our thinking is comparatively simple. The North Star is generating attractive absolute returns over the long term. The risk is impairing capital along the way. A portfolio of well-positioned companies that grow enables us to participate and compound in good times. Focusing on what can go wrong mitigates the impact when disappointments inevitably occur.
Eagle’s investment approach is to employ selectivity, duration, and value-orientation. Selectivity, which for us means holding 25-35 stocks, requires excellent research and judgment. Duration, owning investments for 5-10 years, requires loyal clients and a patient mind. Value-orientation requires a cautious temperament and a willingness to be contrarian at times.
These are our timeless principles. We’ve nurtured a culture based on them. We’ve built a team that embodies them. And we’ve attracted clients who believe in them. However, in all else, we must constantly evolve. Adapting and improving our toolkit as the global economy and opportunity set change has been critical to Eagle’s success.
Warren Buffett, the greatest investor of the past century, illustrates this concept well. He held a few core ideas while also continuing to evolve. He migrated from a deep-value investor, to a buyer of high-quality stocks, to a private equity buyer of entire businesses. His capital base transitioned from a hedge fund partnership to a conglomerate with an insurance liability structure.
For decades, Buffett said that Berkshire didn’t invest in technology businesses because he couldn’t understand them. Admirers who ruled out investing in technology missed that this was Buffett’s best judgment at the time, not a first principle. The cost of missing this distinction was foregoing one of the greatest periods of value creation in history. Ever the pragmatist, Buffett himself adapted. His investment in Apple was the largest in Berkshire’s history and today accounts for approximately 50% of the company’s stock portfolio.
Eagle’s investments in several of today’s digital leaders at moments when other investors were skeptical have been powerful contributors to performance. Rather than defining ourselves as a team that did not invest in technology, we researched these companies with a first principles approach. We identified that heavy investment in intellectual property should be viewed more like capex, and that GAAP accounting was highly distortive for these companies. Moreover, we saw there were powerful scale effects being built that meant historical case studies of mean reversion would not apply well.
Today, the environment is different. Technology stocks are well-liked, and for the past decade, the Russell Growth Index has outperformed the Russell Value Index by almost 6.5% per year. Cumulatively, this has driven a massive difference in outcomes. As a result, a generation of investors saw that investments in unloved industries or companies don’t work, and many are uninterested in engaging at any price.
Energy stocks are an example of this dynamic. After a prolonged period of poor industry performance, structural supply/demand dynamics are attractive. Stocks trade at a historically wide free-cash-flow-yield advantage to the overall market. Geopolitical risks may cause energy price spikes. Despite these dynamics, the sector’s weighting is near all-time lows as a percentage of the overall market. Eagle has made investments here in well-positioned operators.
Another reason that energy stocks offer attractive returns is that short-term earnings are difficult to forecast. Factors like weather and temporary supply/demand imbalances can cause large swings in commodity prices. As more money is managed with short time horizons, fewer investors can hold stocks through uncertainty. This makes it both more important and more lucrative to utilize duration as a distinctive competitive advantage.
The market for investment talent is also changing. There has been a trend by asset allocators to either invest in passive indices or with highly leveraged market-neutral strategies. Multi-manager platforms that run tight risk frameworks and trade frequently have significantly grown assets over the past decade. By contrast, many fundamentally oriented long-only and single-manager hedge funds have struggled. This is creating a good opportunity for Eagle to invest in talent. We have been interviewing over the past several months and expect to onboard 1-2 analysts during the first half of 2024.
We’re still finding good opportunities to deploy capital, though fewer than a year ago when the environment was more pessimistic. Eagle’s portfolio trades at a discount to the overall market despite being comprised of companies that we expect to have superior EPS growth. The discount widens the further we look out, putting time on our side.
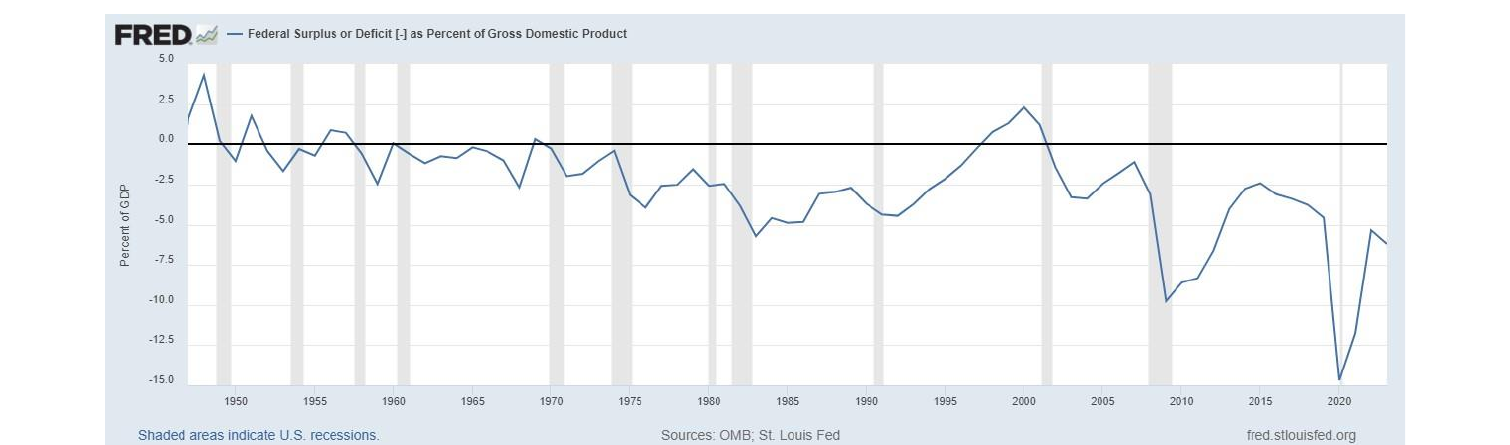
As always, there are headwinds to ponder. One risk that stands out as particularly concerning is the fiscal deficit. It is now running at 6-7% of GDP at a time when we have full employment in the economy. This is extraordinary.
Concern over the deficit is considered passé. Would-be Cassandras have lost credibility after two decades of fearful predictions that didn’t manifest. This is another example where reasoning by first principles is better than reasoning by analogy. We think the situation has fundamentally changed.
For the last twenty years, the fiscal deficit as a percent of GDP was generally lower than the rate of nominal GDP growth. So, while debt grew, GDP grew faster. Debt/GDP didn’t increase. The U.S. levered up some during the 2008 financial crisis, but it was manageable and not recurring. We now have a 6-7% deficit during good times, which will be higher during a recession. This is much higher than the medium-term nominal GDP growth of 4-5%. Debt/GDP will rise every year. Headwinds will worsen as Medicare spending grows and interest rates on the existing debt reset higher.
There are three investment risks to consider: First, this level of stimulus into the economy is inherently inflationary. While we are currently benefiting from disinflation due to supply-side improvements and tighter monetary policy, this may attenuate with time. Second, there will be challenging zero-sum political trade-offs necessary to address this unsustainable level of spending. Finally, reducing the deficit will negatively impact corporate profits. Extra money injected by the government tends to act as high-margin incremental revenue to the corporate sector.
We don’t know whether, when, or how the deficit will be resolved. We try to account for it by assuming a tighter monetary and fiscal environment when estimating earnings and exit multiples over the next 5-10 years. Our work is focused on building a portfolio of resilient businesses that can protect and expand their profit pools. Attractive valuation and the ability to organically compound earnings will be critical to generating returns.
A year ago, there was extreme pessimism as the world faced high inflation and tightened policy. The general view was that we would have persistent inflation, a recession, or both. Instead, the economy grew strongly, inflation slowed, and the stock market boomed. What was missed? What can we learn?
The simplest explanation is that there was too much focus on the demand side and not enough on the supply, or production, side. While policymakers at the Fed or Congress have levers to shift spending around in the short term, the real magic in an economy is what happens on the production side. But compared to macroeconomic aggregates, the supply side is more complicated to generalize about. It is distributed across millions of actors making billions of decisions. The capitalist system functions much like evolution does, with its invisible hand driving fitter species and complex ecosystems.
Covid and its aftermath wreaked havoc on production. There were shortages across the economy. War in Europe then exacerbated issues. As when a forest fire disrupts the equilibrium in an ecosystem, it takes time to adjust and re-grow. There is change to the mix of species, or companies, that flourish.
Last year we saw recovery. Walmart went from pushing through inflation to passing along deflation in discretionary goods. Oil and natural gas prices declined, providing relief to beleaguered consumers and businesses. Shortages became surpluses in industries ranging from automobiles to agriculture to biotech reagents. The lesson is another reminder to be wary of grand macroeconomic forecasts and predictions. Instead, it is critical to focus on the underlying structural forces enabling productivity improvement and how those might be changing. Hours spent researching AI’s impact on the economy of 2030 will have a better return than predicting what the Fed will do next year.
Finally, we’d like to share that Boykin Curry will be stepping down as Co-CIO at the end of February and launching his own investment firm later this year. We are deeply grateful for his many contributions over the years. Boykin will always be a friend (and family) to the firm, and we anticipate continuing to exchange ideas on investments and markets.
As always, if you have any questions or would like to discuss anything herein, please call us at (212) 293-4040. Also, if your financial situation or investment objectives have changed, if your IPO eligibility or U.S. Person status has changed, or if you would like to modify or discuss any investment restrictions or guidelines, please reach out to your contact on the client team or email ClientServices@eaglecap.com.
1 Source: Advent APX. Past performance is not indicative of future results. Data is specific to the Eagle Equity Composite. For additional explanatory information, including concerning the performance of the Eagle Equity Composite as it relates to specific 1-, 5- and 10-year periods, see the additional content located at the conclusion of this letter and at eaglecap.com.
2 Sources: Advent APX, eVestment. Past performance is not indicative of future results. All returns are calculated as of calendar year quarter-ends. This chart represents the returns of the Eagle Equity Composite (net of fees), the S&P 500 Index and the Russell 1000 Value Index for rolling 10-year periods commencing 03/31/1989 (i.e., for the first complete quarterly period following the Eagle Equity Composite’s 12/31/1988 inception date) through 12/31/2023. “Minimum” and “maximum” represent, respectively, the lowest and highest returns for any rolling 10-year period within the date range. “Average” is the average return of all rolling 10-year periods within the date range. For additional explanatory information, including concerning the performance of the Eagle Equity Composite as it relates to specific 1-, 5- and 10-year periods, see the additional content located at the conclusion of this letter and at eaglecap.com.
3 Sources: Advent APX, eVestment (utilizing quarterly returns since inception). Past performance is not indicative of future results. The dark blue line represents the Eagle Equity Composite (net of fees). For additional explanatory information, including concerning the performance of the Eagle Equity Composite as it relates to specific 1-, 5- and 10-year periods, see the additional content located at the conclusion of this letter and at eaglecap.com.
4 Source: U.S. Office of Management and Budget and Federal Reserve Bank of St. Louis, Federal Surplus or Deficit [-] as Percent of Gross Domestic Product [FYFSGDA188S], retrieved from FRED, Federal Reserve Bank of St. Louis; https://fred.stlouisfed.org/series/FYFSGDA188S, February 7, 2024.
5 Eagle Equity Composite holdings during Q4 2023 were as follows: AER; AMZN; AON; BAYRY; COF; CHTR; C; CMCSA; COP; ELV; GE; GOOG/L; GS; HLT; IAC; LBRDA/K; MAR; META; MSFT; NFLX; OXY; PROSY; SAFRY; SAP; SHEL; TSM; UNH; V; WFC; and WWD. The following entities are not currently held in the Eagle portfolio, and reference to these entities is included solely for informational and discussion purposes: Berkshire Hathaway, Apple, and Walmart.
Past performance is not indicative of future results, and there is no assurance that Eagle Capital’s investment objectives will be achieved or that the strategies employed by Eagle Capital will be successful. Except where otherwise indicated, the information contained in this content is based on matters as they exist as of the date of preparation of such material and not as of the date of distribution or any future date. This document does not constitute an offering of advisory services or advice or a recommendation or offer to sell or a solicitation to deal in any security or financial product in any jurisdiction. It is provided for informational purposes only and on the understanding that the recipient has sufficient knowledge and experience to be able to understand and make their own evaluation of the content described herein, any risks associated therewith and any related legal, tax or other material considerations. Recipients should not rely on this material in making any future investment decision. To the extent that the reader has any questions regarding the applicability of any specific issue discussed above to their specific portfolio or situation, clients and prospective investors are encouraged to contact Eagle Capital. Discussions herein relating to risk or any efforts to mitigate risk do not imply that any actions taken by or investment strategies employed by Eagle Capital are in any way low risk or risk free.
This document expresses the views of Eagle Capital as of the date indicated and such views are subject to change without further notice. Eagle Capital has no duty or obligation to update the information contained herein. Certain information contained in this content constitutes “forward-looking statements,” which can be identified by the use of forward-looking terminology such as “may,” “will,” “should,” “expect,” “anticipate,” “project,” “estimate,” “intend,” “continue,” or “believe,” the negatives thereof, other variations thereof or other comparable terminology. Due to various potential risks, uncertainties or actual events, the results or the actual performance of Eagle Capital’s investments may differ materially from those reflected or contemplated in such forward-looking statements.
Any discussion of specific companies contained herein is for informational purposes only and does not represent all of the securities purchased, sold or recommended by Eagle Capital. The reader should not assume that any investments in the securities identified and discussed herein were or will be profitable.
Any index referenced herein is presented because Eagle Capital feels that it serves as a useful point of comparison with aspects of Eagle Capital’s portfolio management. The S&P 500 Index includes approximately 500 leading companies and captures more than three quarters of the total market capitalization. It is float-adjusted and based on the market cap weightings of the securities that comprise the index. In contrast, the Eagle Equity Strategy is highly concentrated and may contain companies not listed in the S&P 500 Index. The Russell 1000 Value Index measures the performance of the large-cap value segment of the US equity universe. It includes those Russell 1000 companies with lower price-to-book ratios and lower forecasted growth values. In contrast, the Eagle Equity Strategy is highly concentrated and may contain companies not listed in the Russell 1000 Value Index. The Russell 1000 Growth Index measures the performance of the large-cap growth segment of the US equity universe. It includes those Russell 1000 companies with relatively higher price-to-book ratios and higher forecasted growth values. In contrast, the Eagle Equity Strategy is highly concentrated and may contain companies not listed in the Russell 1000 Growth Index.
1. Eagle Capital Management, LLC (the “Adviser”) is an investment adviser registered with the Securities and Exchange Commission. Historically, Eagle Capital calculated its performance for periods prior to 01/01/1993 utilizing an equal weighted calculation methodology, whereas for periods commencing on 01/01/1993 performance was calculated utilizing an asset-weighted calculation methodology. Effective as of 03/08/2021, Eagle Capital began presenting performance for all periods by utilizing an asset-weighted calculation methodology in all instances. For periods prior to 01/01/1993, performance reporting includes the carved-out equity segment of two balanced portfolios managed to the Eagle Equity Strategy. These carved-out equity segment returns are calculated using an asset-weighted calculation methodology assuming cash holdings equal to 1% of the AUM of each account.
2. Eagle Capital Management was founded in August 1988 as a corporation. In March 1995, Eagle Capital Management, LLC was formed. The Eagle Equity Composite’s inception date is 12/31/1988. The Eagle Equity Composite is made up of all fee paying tax-free discretionary institutional accounts over $1 million.
3. All fee-paying, discretionary portfolios are included in at least one composite. Composite information is not representative of any individual client account. New portfolios are excluded from composites until deemed fully invested. Portfolios no longer under management are included in historical composites for the periods they were under management; they are excluded for all periods after the last full month they were in place. No leveraged and non-fee paying accounts are included in the Eagle Equity Composite. A list of composite descriptions, limited distribution pooled fund descriptions, and a list of broad distribution pooled funds are available upon request. In addition, policies for valuing investments, calculating performance, and preparing GIPS reports are available upon request. The minimum asset size for a portfolio to be included in the Eagle Equity Composite is $1,000,000, and institutional accounts included in the Eagle Equity Composite do not apply concentration or similar limits at the portfolio level. If withdrawal or performance causes a portfolio included in the Eagle Equity Composite to diminish to a level deemed difficult to implement the intended investment strategy, the portfolio is removed. When taxes are considered, the performance may vary.
4. Do not assume that all transactions will be profitable or that future performance is in any way guaranteed by past results. Performance calculations are on a time-weighted and asset-weighted total return basis and reflect reinvestment of dividends and other earnings. Trade-date accounting valuation is used and income is accrued. Returns from client to client will vary slightly depending on portfolio size, diversification and transaction costs. The equity portion of balanced accounts was included in the Eagle Equity Composite until the first quarter of 1994. In the process of active portfolio management, cash may be held in portfolios pending investment. Product descriptions in this brochure should not be construed to mean that cash is immediately invested.
5. The Firm’s standard annual asset based management fee schedule is 1% of the account’s total assets on the first $5,000,000 and 0.75% thereafter. Gross performance results is net of commissions but does not reflect the deduction of Eagle’s investment advisory fee, which will affect a client’s total return. Net returns are net of trading expenses (commissions), bank fees, foreign withholdings taxes and Eagle’s actual investment advisory fee. The performance presented does not represent the return of any one individual investor. The current presentation may differ from previous presentation of historical data due to differences in assumptions, material market conditions and estimates used to calculate the performance. An individual client account’s net return may differ significantly due to differences in fees, brokerage or other commissions, and/or any other expenses paid and the account’s date of inception. Additional information related to the fees charged by Eagle can be found in its Form ADV Part 2 or in the respective Investment Management Agreement.
6. The currency used to express performance is the U.S. dollar.
7. The Eagle Equity Composite is defined to include all fee-paying non-taxable, institutional accounts. The term institutional accounts include pension plans, public funds, Taft-Hartley, endowments, foundations, trusts, limited partnerships, and corporate accounts while excluding accounts of natural persons (e.g., IRAs). The Eagle Equity Composite has an initial account value minimum of $1,000,000.00. Members of the Eagle Equity Composite are invested in the Eagle Equity Strategy. The Eagle Equity Strategy is not managed to a benchmark. The benchmarks most commonly chosen by our clients based on our Strategy are the S&P 500 and the Russell 1000 Value indices. The S&P 500 Index includes 500 leading companies and captures more than three quarters of the total market capitalization. It is float-adjusted and based on the market cap weightings of the securities that comprise the index. In contrast, the Eagle Equity Strategy is highly concentrated and may contain companies not listed in the S&P 500 Index. The Russell 1000 Value Index measures the performance of the large-cap value segment of the US equity universe. It includes those Russell 1000 companies with lower price-to-book ratios and lower forecasted growth values. In contrast, the Eagle Equity Strategy is highly concentrated and may contain companies not listed in the Russell 1000 Value Index.
8. Eagle Equity Composite Detail (inception date 12/31/1988).
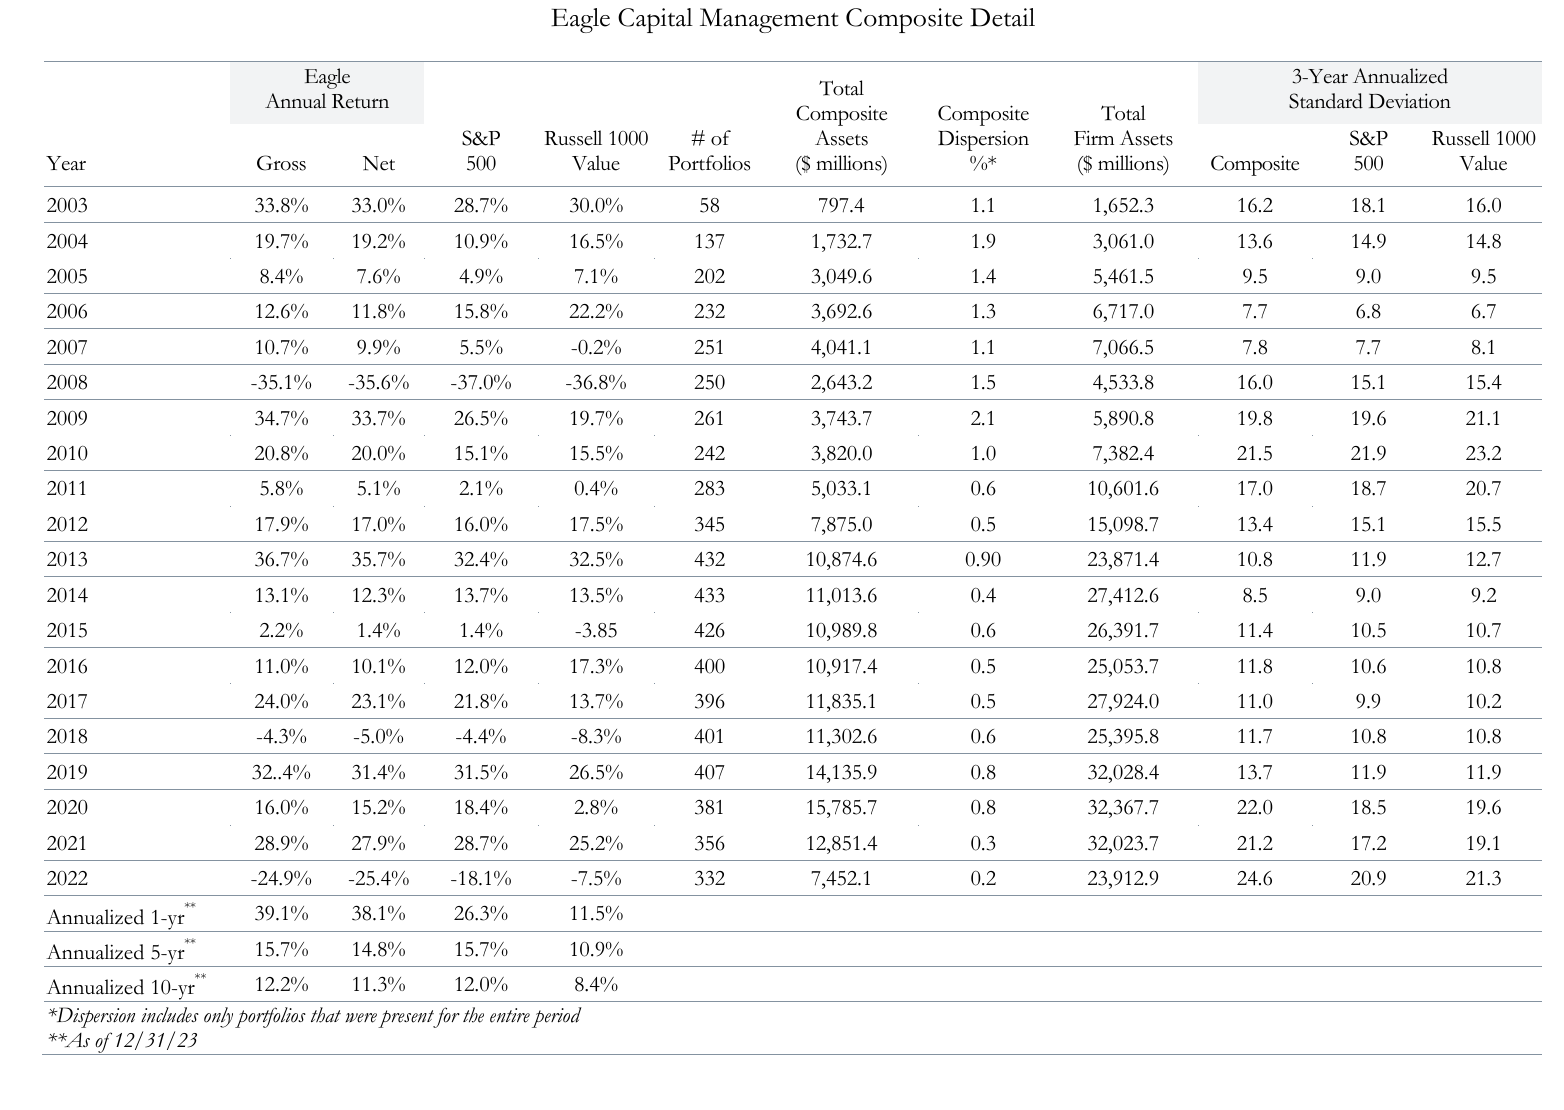
The Eagle Equity Strategy is a concentrated, long-only, primarily large-cap equity strategy. The Eagle Equity Strategy invests solely in U.S. traded securities, including ADRs, generally limits its portfolio holdings to 5% weights at purchase initially and 10% portfolio weights at market value. The strategy also generally limits sector exposure to 35% of the portfolio. The firm considers companies with market capitalizations in excess of $3 billion. The composite creation date was 12/31/1988.
Internal gross composite dispersion is calculated using the gross asset-weighted standard deviation of annual gross returns of those portfolios that were included in the Composite for the entire year. The three-year annualized gross standard deviation measures the variability of the composite and benchmark monthly returns over the previous 36-month period.
Eagle Capital Management, LLC claims compliance with the Global Investment Performance Standards (GIPS®) and has prepared and presented this report in compliance with the GIPS standards. Eagle Capital Management, LLC has been independently verified for the periods 01/01/1993 through 12/31/2022. A firm that claims compliance with the GIPS standards must establish policies and procedures for complying with all the applicable requirements of the GIPS standards. Verification provides assurance on whether the firm’s policies and procedures related to composite and pooled fund maintenance, as well as the calculation, presentation, and distribution of performance, have been designed in compliance with the GIPS standards and have been implemented on a firm-wide basis. The Eagle Equity Composite has had a performance examination for the periods 01/01/1993 through 12/31/2022. The verification and performance examination reports are available upon request. A more detailed description of the assumptions utilized in any of the simulations, models, and/or analyses contained in this report is available upon request. Eagle does not represent that the information contained herein is accurate or complete, and it should not be relied upon as such; Eagle does not undertake any obligation to update the information contained herein. Recipients should not rely on this material in making any investment decision. This document does not constitute advice or a recommendation or offer to sell or a solicitation of any offer to buy any security.
GIPS® is a registered trademark of CFA Institute. CFA Institute does not endorse or promote this organization, nor does it warrant the accuracy or quality of the content contained herein.
Q4 2023 Letter: Celebrating 35 Years | Eagle Capital Management
Eagle's 35-year journey has been defined by resilience, strong long-term returns, and an ability to adapt to changing markets.