One of our CIOs started a virtual bank for his kids when they began earning an allowance. The Bank of Mom & Dad pays 10% to help incentivize savings over spending on Starbucks or Roblox. For the rest of us, finding double-digit returns is a little harder—especially from current valuations.
In recent conversations, we’ve gotten questions on this topic from several of you. What are our return expectations? How does Eagle define value? How do Amazon and ConocoPhillips fit together as large positions in a concentrated portfolio?
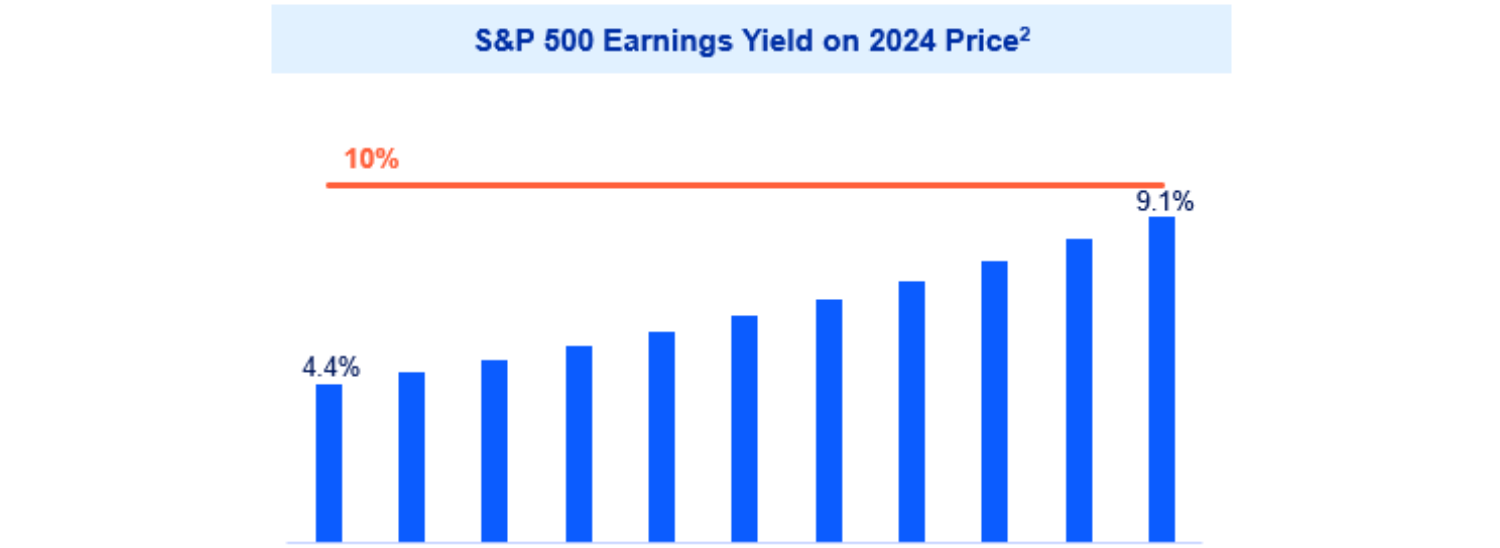
The S&P 500 is trading at a P/E of almost 23x. To better compare with other absolute return alternatives, we can express this as a 4.4% earnings yield. The 10-year treasury, meanwhile, yields 4.6%. It has both a defined coupon payment and a defined duration. The stock market has neither. Investors must make educated guesses about the future and decide whether they’re being sufficiently compensated for the uncertainty they are accepting.
Before looking forward, it helps to look back. A decade ago, the S&P 500 started at a 5.9% earnings yield. EPS grew at over 8% per year, driven by organic earnings growth, reduced tax rates, and share buybacks. An investor purchasing the S&P 500 at the end of 2014 was getting a 13.2% yield on what the index is now producing.¹
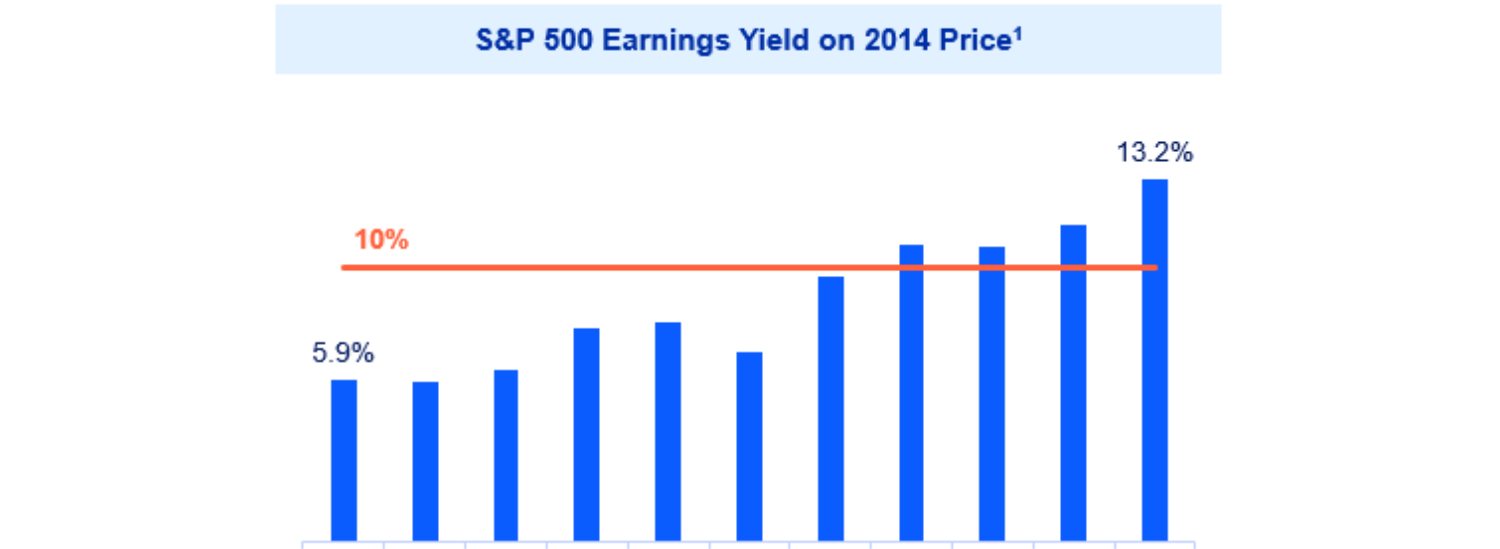
Investors in the S&P 500 also benefited from 3% per year of multiple expansion on top of the earnings growth. When combined with dividends, the index delivered a total return of 13.1% annually. An excellent result against an undemanding starting valuation. Far better than bonds.
The next decade is trickier. With the S&P 500 at a 4.4% yield instead of 5.9%, it starts out at a disadvantage. On top of that, there won’t be as much benefit from tax cuts, and margins may have downside skew. Finally, it’s hard to count on further multiple expansion. Removing tailwinds of 1.5% from yield, 3% from multiple expansion, and 0.5% from tax cuts means that 8% annual returns is a reasonable upper bound. The most significant risk is that many stocks trade at prices that assume valuations will remain elevated. It would not surprise us to see market returns over the next decade at or below the return of a 10-year treasury bond. Getting value in the purchase price matters.
For Eagle, value is not a headline statistic. It is a philosophy and a discipline. It is also anchored in math. If we want our investments to generate double-digit returns, they need to get to a 10% yield on the capital employed and sustain or grow earnings from that level. The longer it takes to get to 10%, the higher the ultimate earnings yield must be to compensate us for time and risk. The illustrative chart below suggests that investors buying the market today may not get to a 10% yield within the next decade.²
Eagle’s approach to navigating this more challenging environment is straightforward. We aim to invest in stocks that are undervalued based on their long-term earnings power while avoiding vulnerable companies that are overpriced. This idea is simple but powerful.
Once again, it helps to look back before we look forward. We analyzed each company in the S&P 500 and compared the price a decade ago to what it is earning today. This “10-year forward earnings yield” is one way to discern long-term value. There was vast dispersion.
With the benefit of hindsight, we see that the most expensive 20% of companies were so overpriced relative to their prospects that they yielded only 3.5% on 10-year forward earnings. These companies exhibited the worst of both worlds: high starting valuation and poor growth. They began the period trading at a 5.3% current yield, which was more expensive than the market, and earnings subsequently declined over the decade. The group comprised a combination of high-expectation stocks that didn’t deliver and companies with earnings deterioration due to a high cyclical starting point or the pressures of structural decline. It is important to remember that most businesses erode over time. Capitalism abides by natural selection. On a long enough scale, everything goes extinct.
By contrast, we now know that the cheapest quintile of companies based on 10-year forward earnings yielded 27%. The group was a mix of companies with valuations reflecting modest expectations and those with earnings that were initially depressed and thus a coiled spring. The five cheapest stocks were two semiconductor firms, two homebuilders, and an insurance company. There were multiple paths to glory.
A decade later, Eagle still holds five companies from that period: Alphabet, Amazon, Aon, Microsoft, and UnitedHealth. In retrospect, this group was trading at a 30% yield based on 10-year forward earnings.
Amazon was a new position for the firm in 2014. At the time, it was the most expensive stock in Eagle’s portfolio based on current earnings. In hindsight, it was our cheapest stock on long-term earnings power, trading at a 10-year forward yield of 40%. Using the current year multiple that is widely available to anyone does not predict whether a stock offers value. Instead, it is critical to form a differentiated view of the long-term earnings power of the business.
Amazon and ConocoPhillips can coexist in a concentrated portfolio because we are agnostic in building our collection of long-term absolute return streams. ConocoPhillips offers a current earnings yield that is approaching double digits. It meets our return goals with modest growth, which we believe it will deliver. Amazon begins at a much lower yield, but we have confidence in its ability to drive high earnings growth over the next decade.
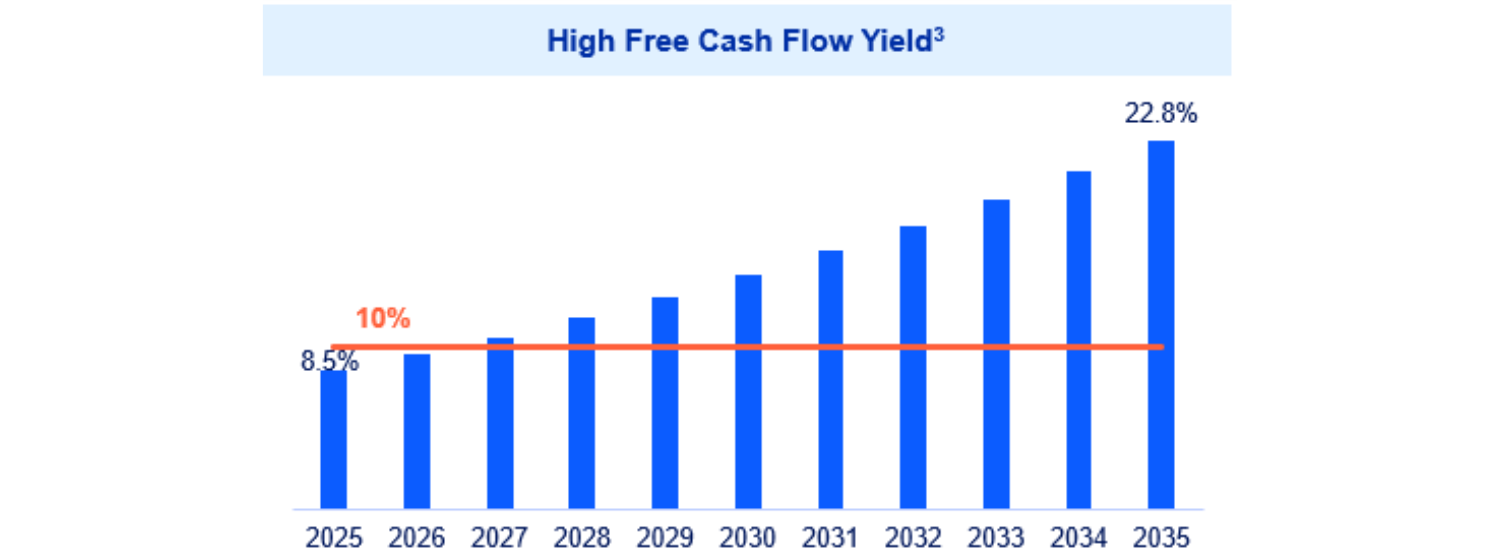
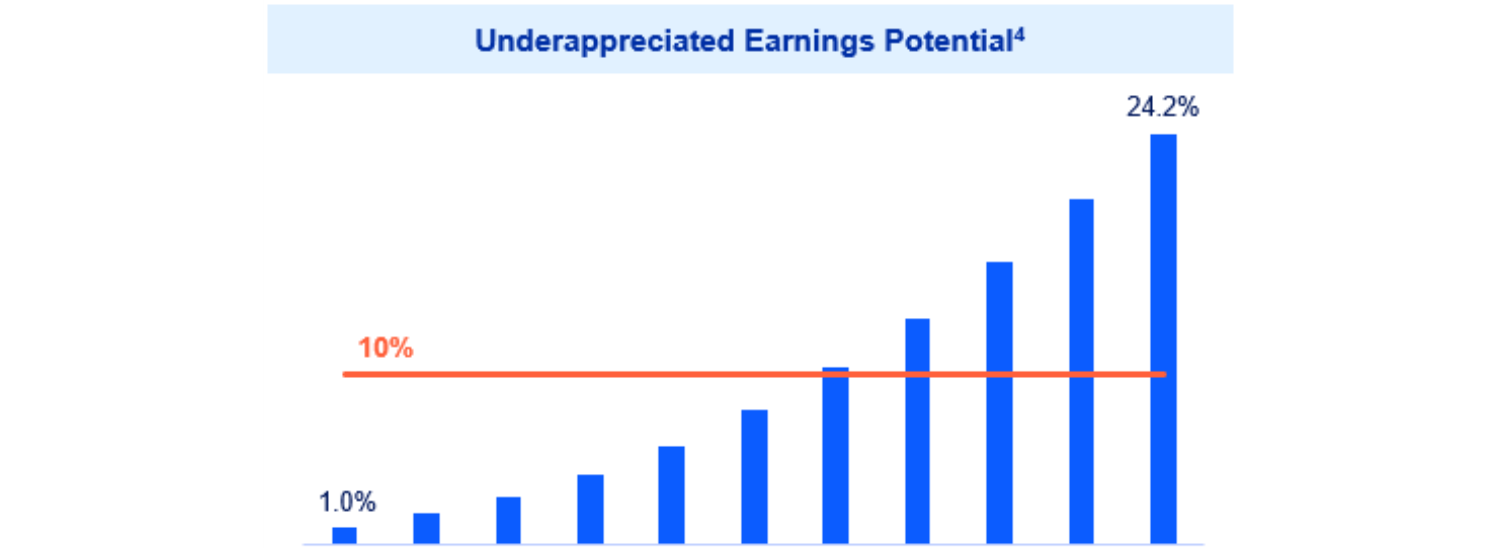
Below, we have laid out a few archetypal Eagle investments and the shape of how we see them achieving attractive long-term absolute returns. In these illustrative examples, we compare the year-end 2024 starting price to the earnings we expect over the next decade.
The first category reflects companies with high starting free cash flow yields and modest growth. Partnering with good capital allocators is crucial because the management team will allocate so much of the company’s market cap over our investment horizon. Investments like AerCap, Comcast, ConocoPhillips, and Shell fit here.³
Companies with underappreciated earnings potential typically have hit a stumble, look expensive in the near term, and are orphaned between growth and value investors. Historic cases are Amazon a decade ago or hotel stocks during the pandemic. Examples today include Humana and Workday.⁴
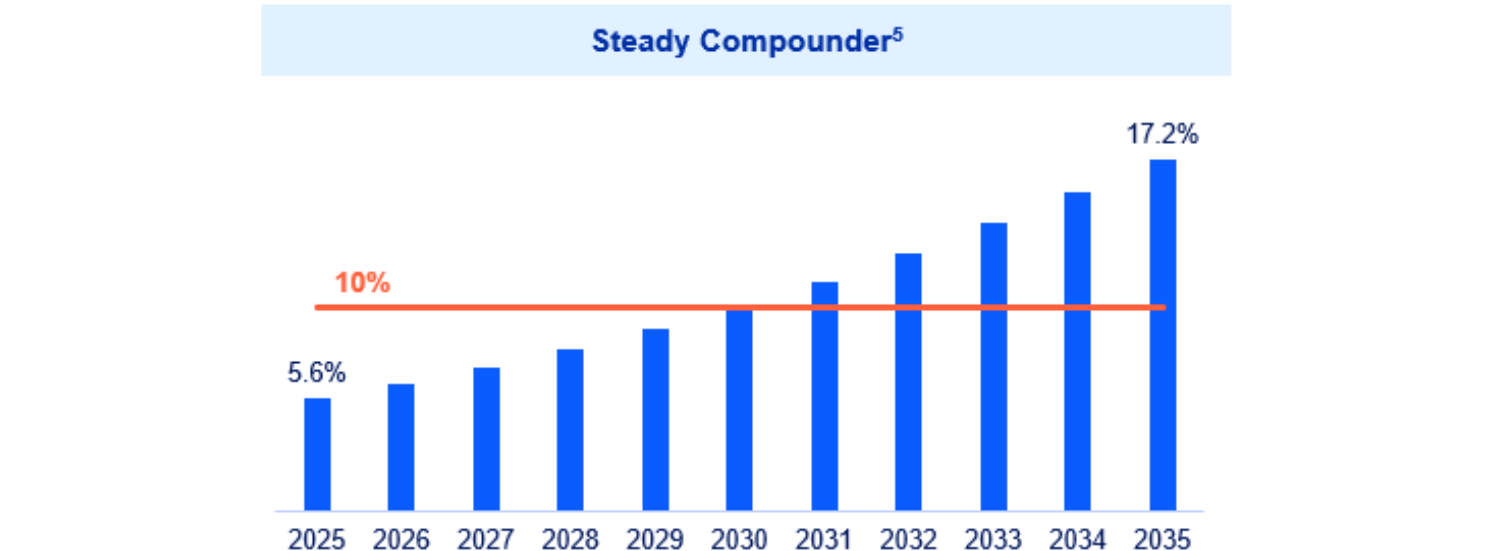
Finally, steady compounders are businesses with moderate current earnings yields and predictable growth. These companies may offer base case returns that aren’t as high as the first two categories, but our cost of capital is generally lower because the range of outcomes is tighter. Investments such as Aon, London Stock Exchange, UnitedHealth, and Woodward are relevant examples.⁵
UnitedHealth is the firm’s longest-standing position. We have continuously held it since 1999. It is up more than a hundredfold. This year, we expect it to generate more than five dollars of earnings for every dollar of Eagle’s initial purchase price—a truly long-term P/E of less than 0.2x.
Investments like this are rare. Three conditions typically need to be in place. First, it must be a great business. Second, it must participate in a large market and continue to capture new growth opportunities. Finally, there must be enough enduring controversies and concerns that the valuation never becomes overpriced.
The last couple of years illustrate the occasional difficulties the managed care industry faces. A combination of cyclical pressures, regulatory change, and headline risk has caused significant earnings pressure and multiple compression. The most dramatic downturn has been in Medicare Advantage, a historically fast-growing and attractive market.
UnitedHealth is the largest player in Medicare Advantage and, accordingly, had a disappointing year. Fortunately, the company’s diverse business mix mitigated the headwinds. By contrast, the second-largest provider, Humana, is a pure play and has suffered greatly. Two years ago, consensus earnings expectations for 2026 were more than $40. Today, consensus EPS has declined to below $15.
Humana is a problematic stock for many investors to own. Earnings may decline from 2025 to 2026 due to mechanical lags in Medicare reimbursement and poor Star Ratings results. Despite this subdued near term, it may be one of the most attractive stocks in the market. Based on our forecast, it has a 10-year forward earnings yield of 30-45%. Eagle established a position last year.
A decade ago, the cheapest 20% of companies in the S&P 500 offered nearly eight times the long-term value of the most expensive 20%. Our goal has always been to capture winners in the former category while limiting exposure to the latter, and so it remains. While the overall market appears richly priced, its wide dispersion presents good opportunities. We continue to lean into our most distinctive competitive advantage: bringing duration to an increasingly short-term world.
As always, if you have any questions or would like to discuss anything herein, please call us at (212) 293-4040. Also, if your financial situation or investment objectives have changed, if your IPO eligibility or U.S. Person status has changed, or if you would like to modify or discuss any investment restrictions or guidelines, please reach out to your contact on the client team or email ClientServices@eaglecap.com.⁶
1 Source: Eagle Capital analysis. This chart reflects calendar year EPS for S&P 500 constituents divided by the S&P 500’s 12/31/2014 closing price (2,059). Each calendar year EPS total is divided by the same 12/31/2014 price (i.e., 2,059) to derive the calendar year earnings yield. For example, the S&P 500’s 2015 EPS is divided by 2,059 to derive an earnings yield of 5.9%. For calendar year 2025, EPS data reflects consensus estimates.
2, 3, 4, 5 Source: Eagle Capital analysis. Included for illustrative purposes only. The performance provided is calculated based on certain inputs, but not all considerations may be reflected therein. It is provided on the understanding that the reader will understand and accept the inherent limitations of such results, will not rely on them in making any investment decision with respect to an investment with Eagle, and will use them only for the purpose of discussing any preliminary interest in making an investment. It should not be assumed that there will be a correlation between this performance and any future returns. No representation is being made that any security or portfolio will or is likely to achieve similar results to those being shown. Readers are urged to consider this information in conjunction with the remainder of the content provided in this letter as well as other materials produced by Eagle (including those available at eaglecap.com). Readers are encouraged to ask questions of Eagle and to conduct further due diligence.
6 Eagle Equity Composite holdings during Q4 2024 were as follows: AA; AER; AMZN; AON; BAYRY; COF; CHTR; CMCSA; COP; DFS; EL; ELV; GE; GEV; GOOG/L; GS; HLT; HUM; LBRDA/K; LNSTY; MAR; META; MSFT; NFLX; OXY; PROSY; SAFRY; SAP; SHEL; TSM; UNH; V; WFC; WWD; and WDAY. The following entities are not currently held in the Eagle portfolio, and reference to these entities is included solely for informational and discussion purposes: Starbucks and Roblox.
Past performance is not indicative of future results, and there is no assurance that Eagle Capital’s investment objectives will be achieved or that the strategies employed by Eagle Capital will be successful. Except where otherwise indicated, the information contained in this content is based on matters as they exist as of the date of preparation of such material and not as of the date of distribution or any future date. This document does not constitute an offering of advisory services or advice or a recommendation or offer to sell or a solicitation to deal in any security or financial product in any jurisdiction. It is provided for informational purposes only and on the understanding that the recipient has sufficient knowledge and experience to be able to understand and make their own evaluation of the content described herein, any risks associated therewith and any related legal, tax or other material considerations. Recipients should not rely on this material in making any future investment decision. To the extent that the reader has any questions regarding the applicability of any specific issue discussed above to their specific portfolio or situation, clients and prospective investors are encouraged to contact Eagle Capital. Discussions herein relating to risk or any efforts to mitigate risk do not imply that any actions taken by or investment strategies employed by Eagle Capital are in any way low risk or risk free.
This document expresses the views of Eagle Capital as of the date indicated and such views are subject to change without further notice. Eagle Capital has no duty or obligation to update the information contained herein. Certain information contained in this content constitutes “forward-looking statements,” which can be identified by the use of forward-looking terminology such as “may,” “will,” “should,” “expect,” “anticipate,” “project,” “estimate,” “intend,” “continue,” or “believe,” the negatives thereof, other variations thereof or other comparable terminology. Due to various potential risks, uncertainties or actual events, the results or the actual performance of Eagle Capital’s investments may differ materially from those reflected or contemplated in such forward-looking statements.
Any discussion of specific companies contained herein is for informational purposes only and does not represent all of the securities purchased, sold or recommended by Eagle Capital. The reader should not assume that any investments in the securities identified and discussed herein were or will be profitable.
Any index referenced herein is presented because Eagle Capital feels that it serves as a useful point of comparison with aspects of Eagle Capital’s portfolio management. The S&P 500 Index includes approximately 500 leading companies and captures more than three quarters of the total market capitalization. It is float-adjusted and based on the market cap weightings of the securities that comprise the index. In contrast, the Eagle Equity Strategy is highly concentrated and may contain companies not listed in the S&P 500 Index.
Q4 2024 Letter: The Power of Patient… | Eagle Capital Management
In a world where finding double-digit returns is increasingly difficult, Eagle's disciplined investment philosophy focuses on seeking to uncover undervalued com