Eagle had a strong year, buoyed by favorable tailwinds as U.S. equity markets continued to perform well. In contrast to much of the last decade, international markets did even better. MSCI ACWI outperformed the S&P 500, returning 22.4% versus 17.9%, respectively. This has happened only once in the past ten years.
American equity market exceptionalism over the past 15 years has been anchored in good fundamentals. U.S. tech companies built enormously valuable businesses. The banking system was proactively recapitalized after the 2008 financial crisis. Commodity prices have generally been subdued, and the U.S. improved its energy situation with the shale revolution. Finally, despite its flaws, the U.S. has pursued policies that are more pro-growth than those of much of the rest of the world. These fundamentals led to higher returns, premium valuations, and an increasingly overvalued USD.
The U.S. is the deepest market, has many excellent companies, and is the economy we know best. However, we’ve seen a growing number of attractive opportunities elsewhere, and over the past few years, we have increased our investments in internationally listed companies. We believe the investments we’ve made both improve our expected returns and reduce portfolio risk. As a category, they were solid contributors in 2025, outperforming both Eagle and the broader market.1
Eagle has historically generated long-term returns with more consistency than the overall market. While we have done well enough in rising markets, we’ve generated more alpha in difficult ones. One reason is that we have the freedom to look different than the index.
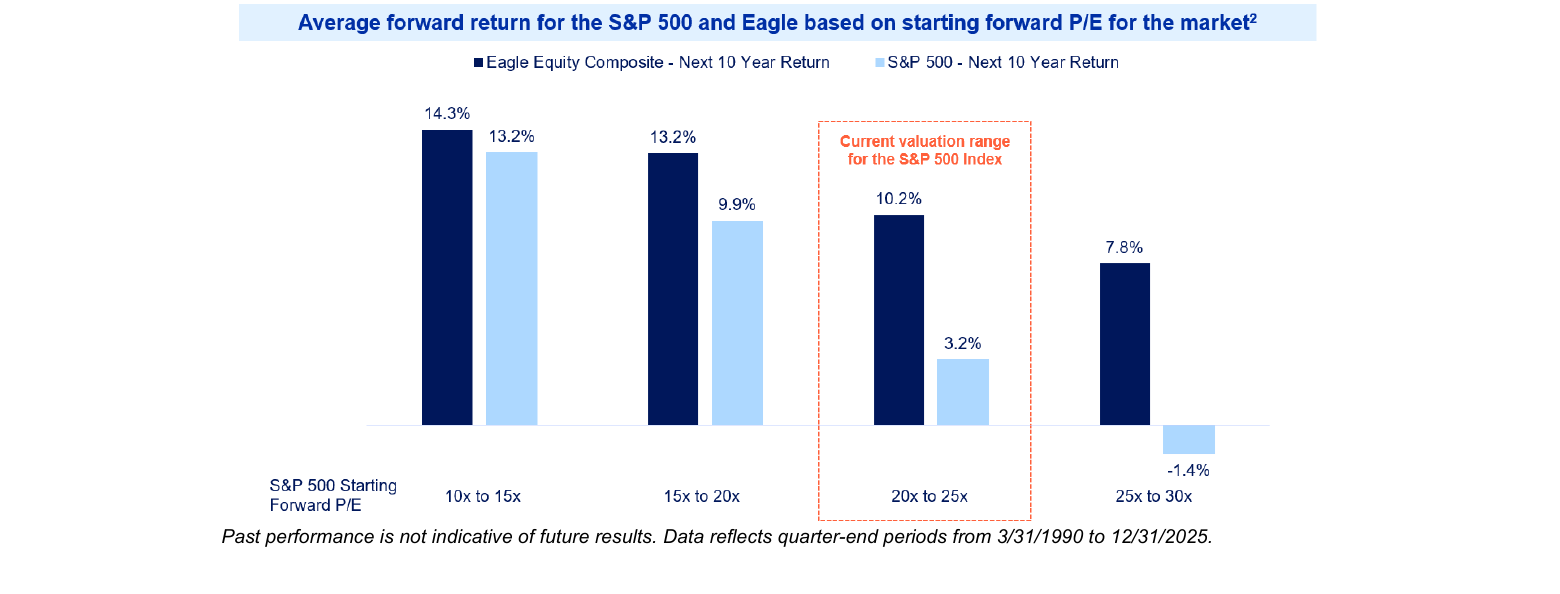
The chart below shows the average forward return for the S&P 500 and for Eagle across different valuation environments. As you can see, when the market is cheap, the next decade has tended to be great for both Eagle and the S&P 500. As the market gets more expensive, it exerts a downward gravitational force on future returns. But where the index is constrained by a high starting point, Eagle can adjust the portfolio to seek out bargains. While we also face downward pressure, our returns tend to be more resilient. Finding value in a handful of international investments exemplifies this approach.
The international businesses we own are multinationals. They both compete and partner with U.S. companies that we follow. Some could just as easily be based in the U.S., with significant footprints here and a global end-market mix similar to that of U.S. peers. They are also leaders in their industries, in some cases operating functional monopolies.
ASML, based in the Netherlands, is the world’s sole manufacturer of extreme ultraviolet (EUV) lithography tools for the semiconductor industry. The company operates as an effective monopoly, supplying every major logic and memory foundry that produces leading-edge semiconductors. Its customers include Taiwan Semiconductor Manufacturing Company (TSMC), Samsung, Intel, and SK Hynix, each buying systems that can cost more than $200 million. Eagle acquired the position in 2025 during a temporary downturn in the business. At the time, there was a powerful narrative that the industry was at “peak lithography” and that, with TSMC as the company’s only healthy customer, ASML’s strategic leverage had weakened. Most of the issues were cyclical: as memory customers healed and TSMC needed capacity, ASML orders improved accordingly.
ASML’s competitive position is a remarkable story of industrial innovation. 30 years ago, the company only had 15% share of the lithography market, with two Japanese firms dominating the rest. As the industry moved to deep ultraviolet (DUV) and immersion lithography, ASML began to pull away. By 2006, it had more than 50% of the market. Later, ASML was the only firm able to migrate to EUV. Because this technology is so expensive and in demand, the company’s 100% share here translates to well over 90% of the total lithography market. ASML is well positioned to capitalize on the growing demand for complex, larger silicon wafers, driven by AI adoption and increasingly challenging physics. We believe it will grow EPS in the mid-to-high-teens over the next five years.
Bayer, a food and health science conglomerate, operates the world’s largest crop science business, with leading market share in the U.S. and South America. It also operates pharma and over-the-counter consumer health businesses. Eagle initially acquired the position in 2023.
Bayer has been plagued by poor decisions made by the prior management team. The 2018 acquisition of Monsanto was overpriced and entailed legal liabilities that escalated into a significant problem. The controversy revolves around glyphosate. The EPA says it is safe; numerous courts in the U.S. have found otherwise. We believe new leadership is making progress toward resolving the legal issues, with paths through both Congress and the Supreme Court underway. Agriculture is already in a downcycle, and earnings should improve from here. Bayer’s pharmaceutical business is poised to resume growth following a period of underinvestment in R&D. Finally, management is shedding costs from an overly bureaucratic culture.
Crop science R&D is likely to benefit from advances in AI, which Bayer can capitalize on. The company has the broadest and deepest seed and trait data sets. As legal settlements decline and organic earnings improve, we think free cash flow can double over the next five years.
The London Stock Exchange Group (“LSEG”) operates critical financial market infrastructure and data businesses. Data & Applications is a subscription business that competes with Bloomberg, offering mission-critical feeds to financial institutions. The Markets business houses execution and clearing venues. The London Clearing House has a near-monopoly in interest rate derivatives, and Tradeweb is the leading electronic fixed-income trading platform. FTSE Russell is a leading financial index business, with a mix of royalty and subscription revenue. Eagle made its initial investment in 2024 and continued to build it last year. We previously highlighted it in our 3Q25 letter.
Reasonable concerns have emerged about AI-related disruption risk, particularly in the Data & Applications business. While there are risks here, we think they are overblown and miss the potential upside. The primary concern of investors is the extent to which new tools, such as Claude, may displace use cases for the Refinitiv desktop. There are also questions about whether existing human workflows will be wholly replaced by agents. Both of these situations may transpire in part. At the same time, the company’s data assets should benefit from more use and broader distribution. Our current judgment is that AI innovation is more likely to be a net benefit for LSEG rather than a net headwind. Over the next five years, we expect the company to deliver mid-to-high teens total returns, driven by EPS growth and dividend yield.
SAP is the world’s largest enterprise software application company, with its ERP systems serving as the backbone for much of the Fortune 500. The company is in the midst of a multi-year cloud transition, converting a massive installed base of on-premise customers to higher-value cloud subscriptions. This shift initially compressed near-term margins but dramatically improves revenue durability, lifetime customer value, and long-term earnings power. This customer migration path arguably makes it one of the more predictable growth stories in software. Eagle established its position in 2023.
SAP’s moat is rooted in extraordinary switching costs: its software is so deeply embedded in customers’ core financial, supply chain, and HR processes that rip-and-replace is prohibitively expensive and disruptive, resulting in retention rates well above 90%. AI innovation presents both risks and opportunities for the company. Given its central position, SAP has time, data gravity, and control to deliver greater value via its services. However, if the company doesn’t execute well, AI disruptors may supplant upselling and bundling opportunities that SAP could have secured. We think the range of outcomes is more about forecasting the right growth rate than about existential disruption. We expect the combined dividend yield and EPS growth to be approximately 20% annually over the next five years.
Shell is one of the world’s largest integrated energy companies, operating across LNG, upstream exploration and production, refined products, gas stations, and chemicals. The company’s LNG business is the largest in the world, providing differentiated exposure to secular growth in globally traded natural gas. New leadership has prioritized shareholder returns and hydrocarbon cash flows. Eagle made its investment in 2022.
The company has become a prolific returner of capital, buying back nearly 25% of its shares over the past four years. When combined with a 4% dividend yield, the total shareholder payout is approximately 10% annually. It continues to trade at a discount to U.S. peers, driven in part by fund flows away from energy in Europe and the U.K. We expect total returns in the mid-teens, driven by modest earnings growth and the large shareholder payout.
TSMC is the world’s dominant pure play semiconductor foundry, manufacturing more than 90% of advanced logic chips for fabless designers including Apple, Nvidia, Qualcomm, Broadcom, and AMD. The company’s scale advantages and process technology leadership create a deep moat. TSMC is both broadly diversified and at the epicenter of the AI infrastructure buildout. Eagle established its position in 2023 during an industry downturn.
The company is significantly increasing capex in Taiwan and globally to meet growing demand. As complexity increases, TSMC is raising prices accordingly. While we expect competitors to make progress, TSMC is vastly larger and technologically ahead. Moreover, there is a natural scale effect that consolidates the broad base of fabless semiconductor design firms as customers of a single, efficient, capital-intensive manufacturer. We expect the company’s EPS to grow by approximately 20% annually over the next five years.
Eagle’s portfolio had an active year, with continued market dispersion creating opportunities to upgrade. As the chart above suggests, elevated U.S. index valuations have historically been a headwind to forward returns. But in expensive markets, Eagle has often added the most value. Flexibility to find bargains matters more when the index isn’t one. We believe the portfolio is well-positioned to compound from here. Thank you for your continued partnership.
As always, if you have any questions or would like to discuss anything herein, please call us at (212) 293-4040. Also, if your financial situation or investment objectives have changed, if your IPO eligibility or U.S. Person status has changed, or if you would like to modify or discuss any investment restrictions or guidelines, please reach out to your contact on the client team or email ClientServices@eaglecap.com.3
1 Sources: Advent APX; Eagle Capital analysis. For the purposes of this letter, our internationally listed companies are ASML, Bayer, LSEG, SAP, Shell, and TSMC. For the period that we owned each company in 2025, this group had an unweighted median return of 31.8% and an unweighted average return of 37.9% (in all cases gross of any fees and expenses). By comparison, in 2025, the Eagle Equity Strategy returned 17.5% (net of fees and expenses) and the S&P 500 returned 17.9%. For additional information regarding Eagle’s index comparisons and since inception performance calculation methodology, including specifically as it relates to 1-, 5-, and 10-year periods, please see the final pages of this letter.
2 Sources: Bloomberg; CapIQ; Advent APX; Eagle Capital analysis. The chart reflects the average 10-year returns for the S&P 500 Index and the Eagle Equity Composite based on the starting quarter end forward P/E for the market. Data reflects the earliest quarter end forward PE data available for both the S&P 500 and the Eagle Equity Composite (i.e., 03/31/1990). For the avoidance of doubt, there were no forward PE values below 10, or above 30. Forward PE estimates are based on consensus sell-side earnings estimates over the upcoming twelve months for the S&P 500. All returns are calculated as of calendar year quarter-ends for rolling 10-year periods commencing 03/31/1990, and the last applicable rolling 10-year period spans 12/31/2015–12/31/2025. For additional information regarding Eagle’s index comparisons and since inception performance calculation methodology, including specifically as it relates to 1-, 5-, and 10-year periods, please see the final pages of this letter.
3 Eagle Equity Composite holdings during Q4 2025 were as follows: AA; AER; AMZN; AON; ASML; BAYRY; CHTR; CMCSA; COF; COP; DHR; EL; ELV; GEV; GOOG/L; HLT; HUM; INTU; LBRDA/K; LEN; LNSTY; LSEGY; MELI; META; MLM; MSFT; PTC; SAP; SHEL; TSM; UNH; VMC; WDAY; WFC; and WWD. The following entities are not currently held in the Eagle portfolio, and reference to these entities is included solely for informational and discussion purposes: Samsung, Intel, SK Hynix, Anthropic, Apple, Nvidia, Qualcomm, Broadcom, and AMD.
Past performance is not indicative of future results, and there is no assurance that Eagle Capital’s investment objectives will be achieved or that the strategies employed by Eagle Capital will be successful. Except where otherwise indicated, the information contained in this content is based on matters as they exist as of the date of preparation of such material and not as of the date of distribution or any future date. This document does not constitute an offering of advisory services or advice or a recommendation or offer to sell or a solicitation to deal in any security or financial product in any jurisdiction. It is provided for informational purposes only and on the understanding that the recipient has sufficient knowledge and experience to be able to understand and make their own evaluation of the content described herein, any risks associated therewith and any related legal, tax or other material considerations. Recipients should not rely on this material in making any future investment decision. To the extent that the reader has any questions regarding the applicability of any specific issue discussed above to their specific portfolio or situation, clients and prospective investors are encouraged to contact Eagle Capital as well as to review other materials produced by Eagle Capital (including those available at eaglecap.com). Discussions herein relating to risk or any efforts to mitigate risk do not imply that any actions taken by or investment strategies employed by Eagle Capital are in any way low risk or risk free.
This document expresses the views of Eagle Capital as of the date indicated and such views are subject to change without further notice. Eagle Capital has no duty or obligation to update the information contained herein. Certain information contained in this content constitutes “forward-looking statements,” which can be identified by the use of forward-looking terminology such as “may,” “will,” “should,” “expect,” “anticipate,” “project,” “estimate,” “intend,” “continue,” or “believe,” the negatives thereof, other variations thereof or other comparable terminology. Due to various potential risks, uncertainties or actual events, the results or the actual performance of Eagle Capital’s investments may differ materially from those reflected or contemplated in such forward-looking statements.
Any discussion of specific companies contained herein is for informational purposes only and does not represent all of the securities purchased, sold or recommended by Eagle Capital. The reader should not assume that any investments in the securities identified and discussed herein were or will be profitable.
Any index referenced herein is presented because Eagle Capital feels that it serves as a useful point of comparison with aspects of Eagle Capital’s portfolio management. The S&P 500 Index includes approximately 500 leading companies and captures more than three quarters of the total market capitalization. It is float-adjusted and based on the market cap weightings of the securities that comprise the index. In contrast, the Eagle Equity Strategy is highly concentrated and may contain companies not listed in the S&P 500 Index. The MSCI ACWI Index captures large and mid-cap representation across 23 developed markets and 24 emerging markets countries. With 2,515 constituents, the index covers approximately 85% of the global investable equity opportunity set. In contrast, the Eagle Equity Strategy is highly concentrated and may contain companies not listed in the MSCI ACWI Index.
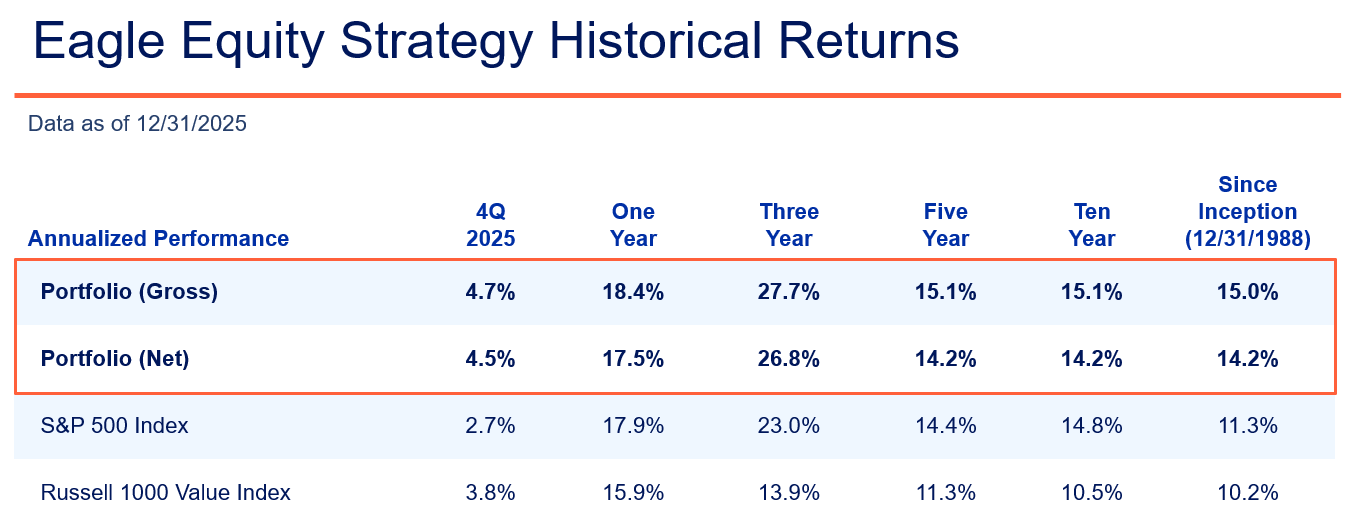
Past performance is not indicative of future results. Information shown is specific to the Eagle Equity Composite. For the GIPS Report in relation to the Eagle Equity Composite, see the content at the conclusion of this letter.

1. Eagle Capital Management, LLC (the “Adviser” or “Eagle”) is an investment adviser registered with the Securities and Exchange Commission. The Eagle Equity Composite’s inception and creation date is 12/31/1988.
2. Originally, for periods prior to 1/1/1993, Eagle calculated performance utilizing an equal-weighted calculation methodology, and performance reporting included the carved-out equity segment of two balanced portfolios managed to the Eagle Equity Strategy. Each of these carved-out equity segment returns were calculated using an asset-weighted calculation methodology assuming cash holdings equal to 1% of the assets under management of each account. For periods commencing on 1/1/1993, performance was calculated utilizing an asset-weighted calculation methodology. Effective as of 3/8/2021, Eagle began presenting performance for all periods by utilizing an asset-weighted calculation methodology in all instances.
3. The Eagle Equity Composite includes all fee-paying, non-taxable discretionary institutional accounts, such as pension plans, public funds, Taft-Hartley, endowments, foundations, trusts, limited partnerships, and corporate accounts, while excluding accounts of natural persons (i.e., IRAs). The minimum initial asset size for inclusion is $1 million. Concentration or similar limits do not apply at the portfolio level. If a withdrawal or performance causes a portfolio to diminish to a level deemed difficult to implement the intended investment strategy, the portfolio may be removed. Members of the Eagle Equity Composite are invested in the Eagle Equity Strategy.
4. The Eagle Equity Strategy is a concentrated, long-only, primarily large-cap equity strategy which invests solely in U.S.-traded securities, including ADRs, and generally limits its portfolio holdings to 5% at purchase initially and 10% at market value. Sector exposure is generally limited to 35% of the portfolio, focusing on companies with market capitalizations over $3 billion.
5. The Eagle Equity Strategy is not managed to a benchmark. The most common benchmarks chosen by the Adviser’s clients based on its strategy are the S&P 500 Index and the Russell 1000 Value Index which are included above.
6. Do not assume that all transactions will be profitable or that future performance is in any way guaranteed by past results. Performance calculations are on a time-weighted and asset-weighted total return basis and reflect reinvestment of dividends and other earnings. Returns from client to client will vary slightly depending on portfolio size, diversification, and transaction costs. In the process of active portfolio management, short-term investments may be held in portfolios pending investment. Product descriptions in this brochure should not be construed to mean that cash is immediately invested.
7. The Adviser’s standard annual management fee is 1.00% on the first $5 million of assets and 0.75% thereafter. Gross performance is net of commissions but does not reflect Eagle’s investment advisory fee, which affects a client’s total return. Net performance is net of commissions, bank fees, foreign withholdings taxes, and Eagle’s actual fee. The performance presented does not represent any individual investor’s return. The current presentation may differ from previous presentations due to changes in assumptions, market conditions, and estimates used in calculations. Individual client net returns may differ significantly based on fees, brokerage charges, commissions, other expenses, and account inception date. Additional information related to the Advisor’s fees can be found in its Form ADV Part 2 or the respective Investment Management Agreement.
8. Internal gross composite dispersion is calculated using the gross asset-weighted standard deviation of annual gross returns of those portfolios that were included in the composite for the entire year. The three-year annualized gross standard deviation measures the variability of the composite and benchmark monthly returns over the previous 36-month period. The currency used to express performance is the U.S. dollar.
9. Eagle Capital Management, LLC claims compliance with the Global Investment Performance Standards (GIPS®) and has prepared and presented this report in compliance with the GIPS standards. Eagle Capital Management, LLC has been independently verified for the periods 1/1/1993 through 12/31/2024. A firm that claims compliance with the GIPS standards must establish policies and procedures for complying with all the applicable requirements of the GIPS standards. Verification provides assurance on whether the firm’s policies and procedures related to composite and pooled fund maintenance, as well as the calculation, presentation, and distribution of performance, have been designed in compliance with the GIPS standards and have been implemented on a firm-wide basis. The Eagle Equity Composite has had a performance examination for the periods 1/1/1993 through 12/31/2024. The verification and performance examination reports are available upon request.
10. The following materials are available upon request: (i) descriptions of composites, limited distribution pooled funds, and broad distribution pooled funds; (ii) policies for valuing investments, calculating performance, and preparing GIPS Reports; and (iii) a more detailed description of the assumptions utilized in any of the simulations, models, and/or analyses contained in this report. Eagle does not represent that the information contained herein is accurate or complete, and it should not be relied upon as such; Eagle does not undertake any obligation to update the information contained herein. Recipients should not rely on this material in making any investment decision. This document does not constitute advice or a recommendation or offer to sell or a solicitation of any offer to buy any security.
GIPS® is a registered trademark of CFA Institute. CFA Institute does not endorse or promote this organization, nor does it warrant the accuracy or quality of the content contained herein.
Q4 2025 Letter: Value Beyond Borders | Eagle Capital Management
For only the second time in a decade, international markets outperformed the U.S. Eagle discusses six globally listed investments and why the freedom to look di